

These plots show significant wave height measured by wave buoys along the California coast from Point Conception to the Oregon border. They are regenerated automatically every 6 hours from the latest observations. All dates and times are in UTC.
What is significant wave height?
Waves at sea come in all sizes, even within a single hour, so wave reports use a single summary number: significant wave height (Hs). It is roughly the average height, from trough to crest, of the biggest one-third of the waves. It is a typical “big wave,” not the biggest: in any half hour, the single largest wave can be nearly twice as high. To learn where the idea came from and how buoys measure it, see More about significant wave height at the bottom of this page.
Wave height over the past 14 days
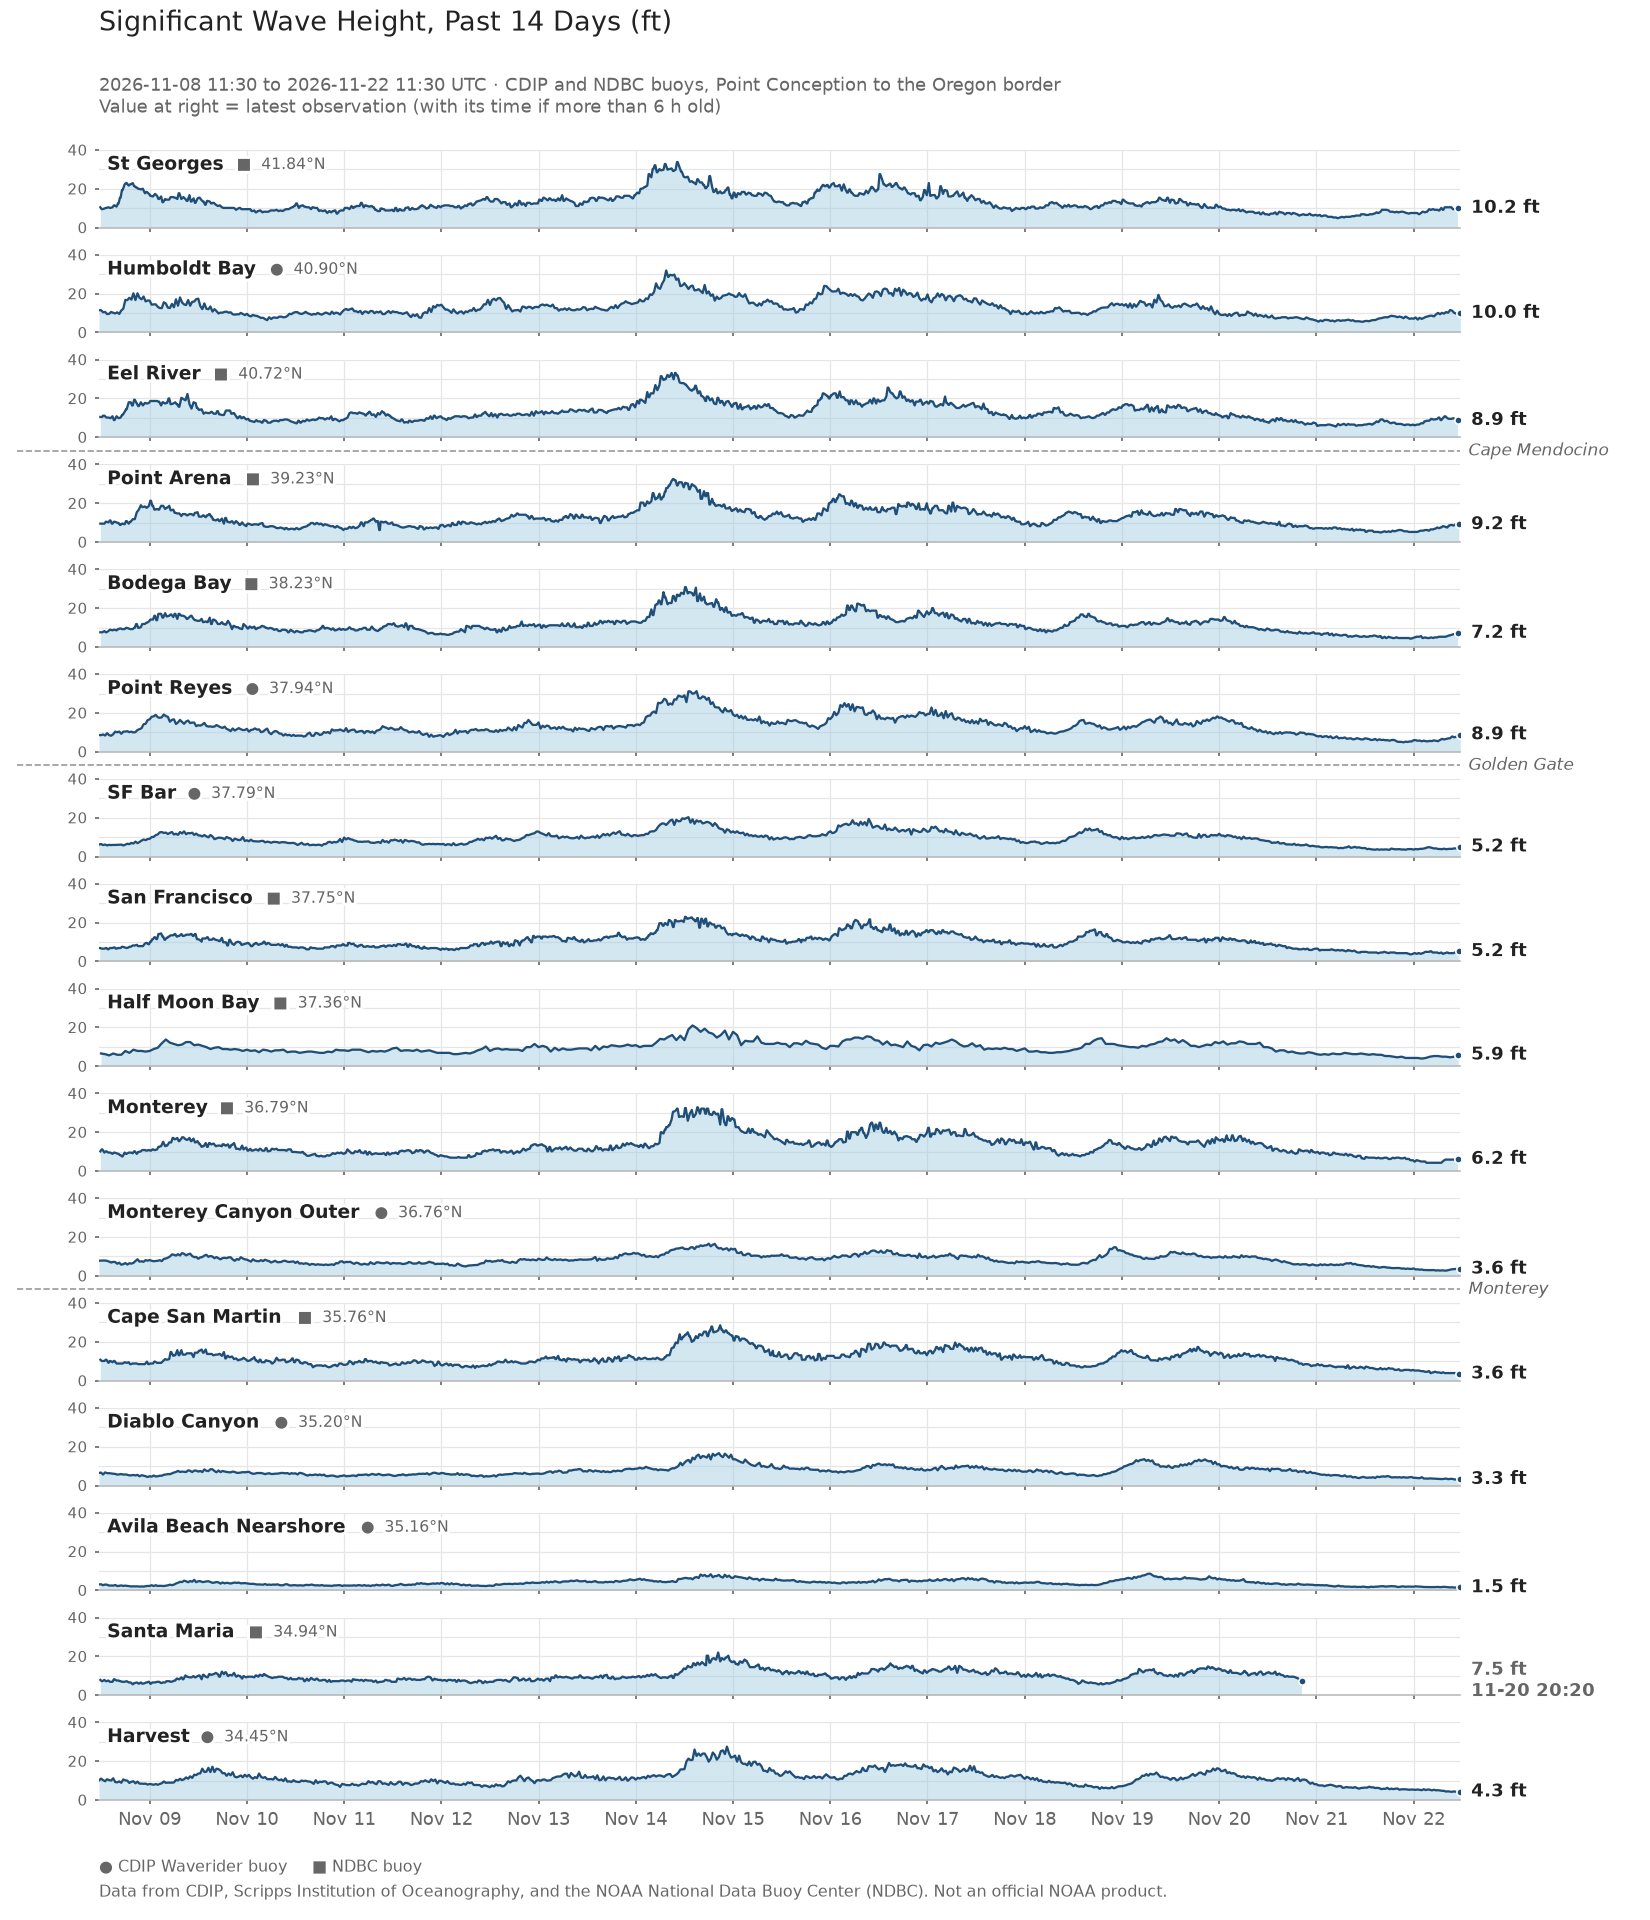
How to read it: Each panel is one buoy, labeled with its name and latitude and ordered from north (top) to south (bottom). A circle next to the name marks a CDIP Waverider buoy and a square marks an NDBC buoy. Time runs left to right, with the most recent observation at the right edge, and wave height is on the vertical axis in feet. All panels share the same 0–40 ft scale, so you can compare heights directly between stations.
The number at the right of each panel is the latest reading. If that reading is more than 6 hours old, which usually means the buoy has stopped reporting or data services are delayed, the label also shows the date and time (UTC) of its last report and the record ends early.
Look for peaks that appear at several stations within a few hours of each other. These usually mark a swell arriving from a distant storm or a local wind event. Comparing when the peak reaches each station shows which direction it came from: a northwest winter swell generally arrives at northern stations first, and a south swell in summer arrives at southern stations first. You will also notice that buoys in sheltered or nearshore locations, such as Avila Beach Nearshore, record much smaller waves than exposed offshore buoys during the same event.
How the distribution of wave height has changed over the past month (animated)
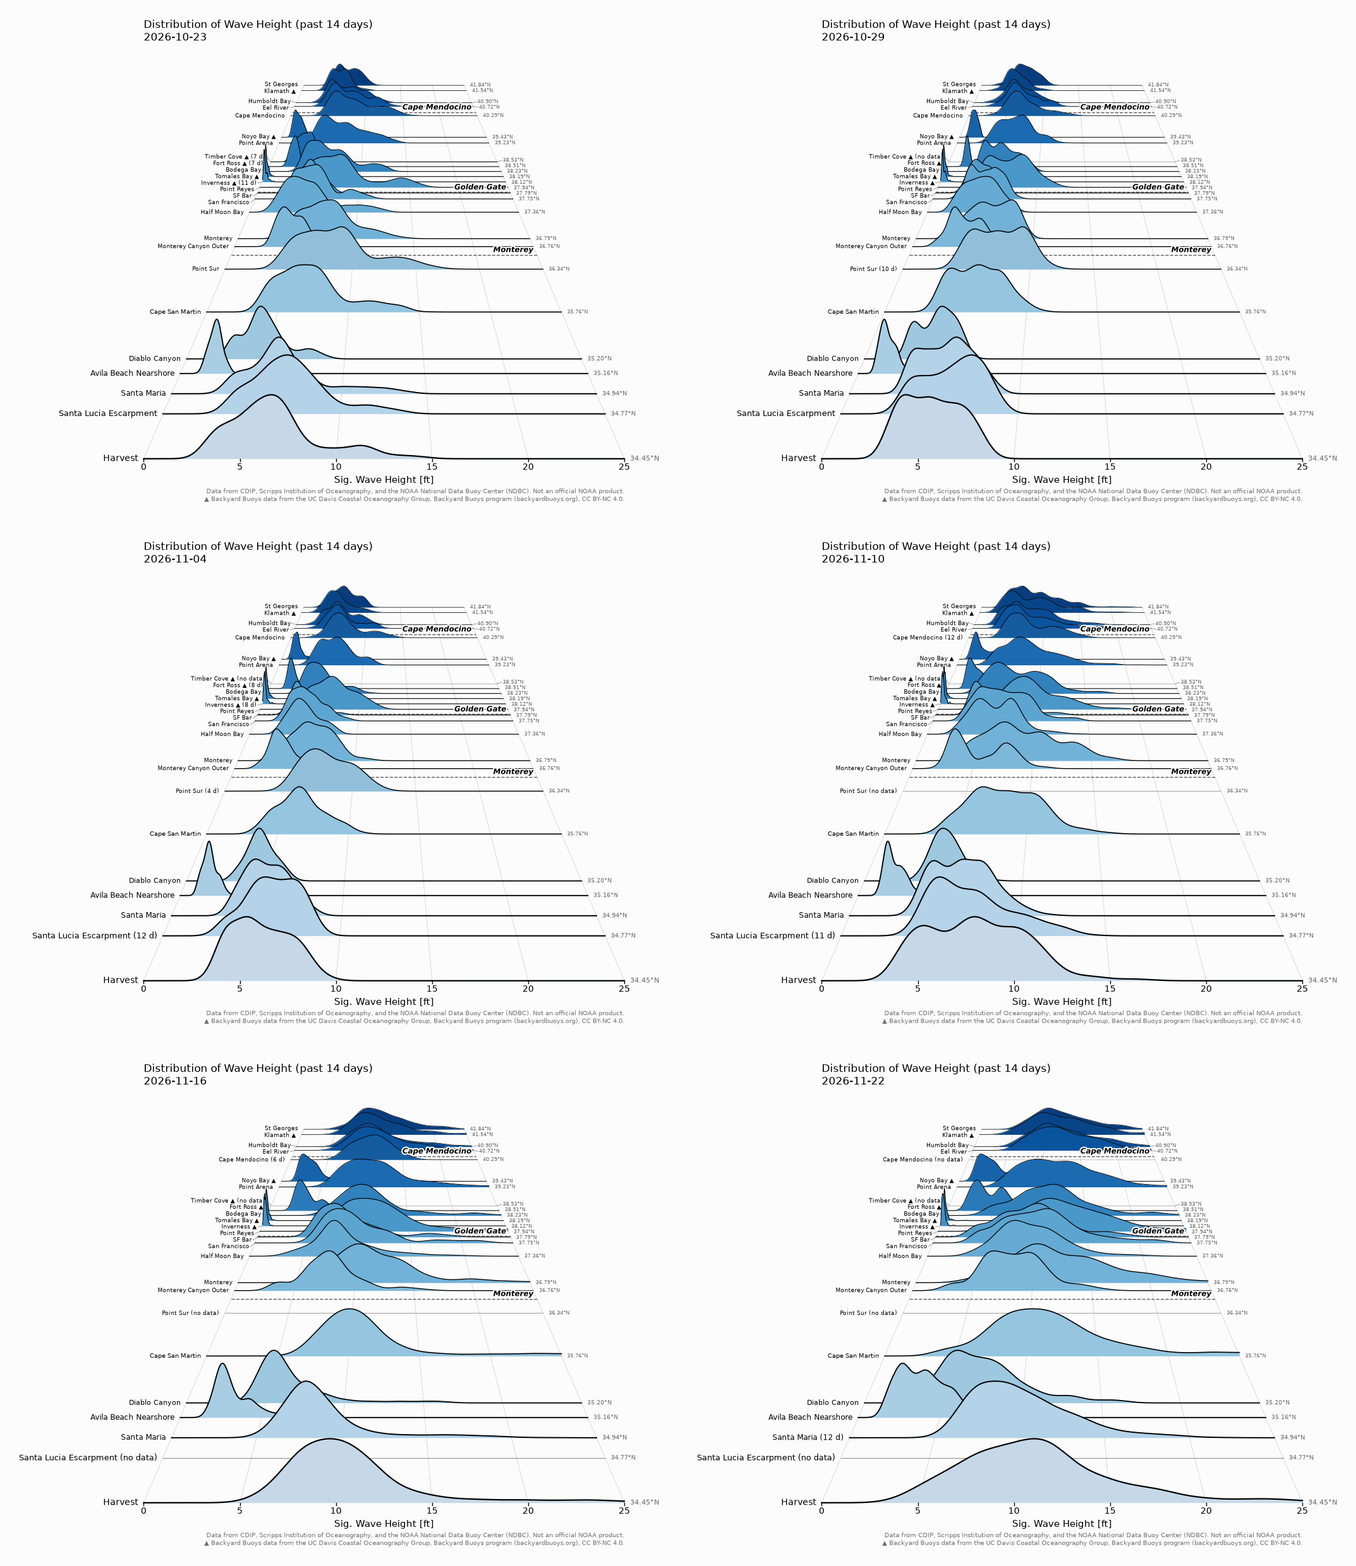
How to read it: Instead of a time series, each buoy’s wave heights are summarized as a single curve, or ridge. This gives a quick view of how the wave climate has changed from the past 14 days: if the mountains are shifting right the waves are getting larger and are likely tracking a storm. The horizontal position is wave height in feet, and the higher the ridge at a given value, the more often that wave height was observed.
Details: Each frame of the animation covers 14 days, and the date in the title steps forward through the past month. As storms pass through, the ridges shift to the right and develop long tails toward larger waves. In calm periods they shift left and narrow. This plot includes additional nearshore buoys from the Backyard Buoys program, marked with ▲. A buoy with less than a full 14 days of data has its number of days in parentheses after its name, for example “(11 d)”.
Distribution of wave height over the past 30 days
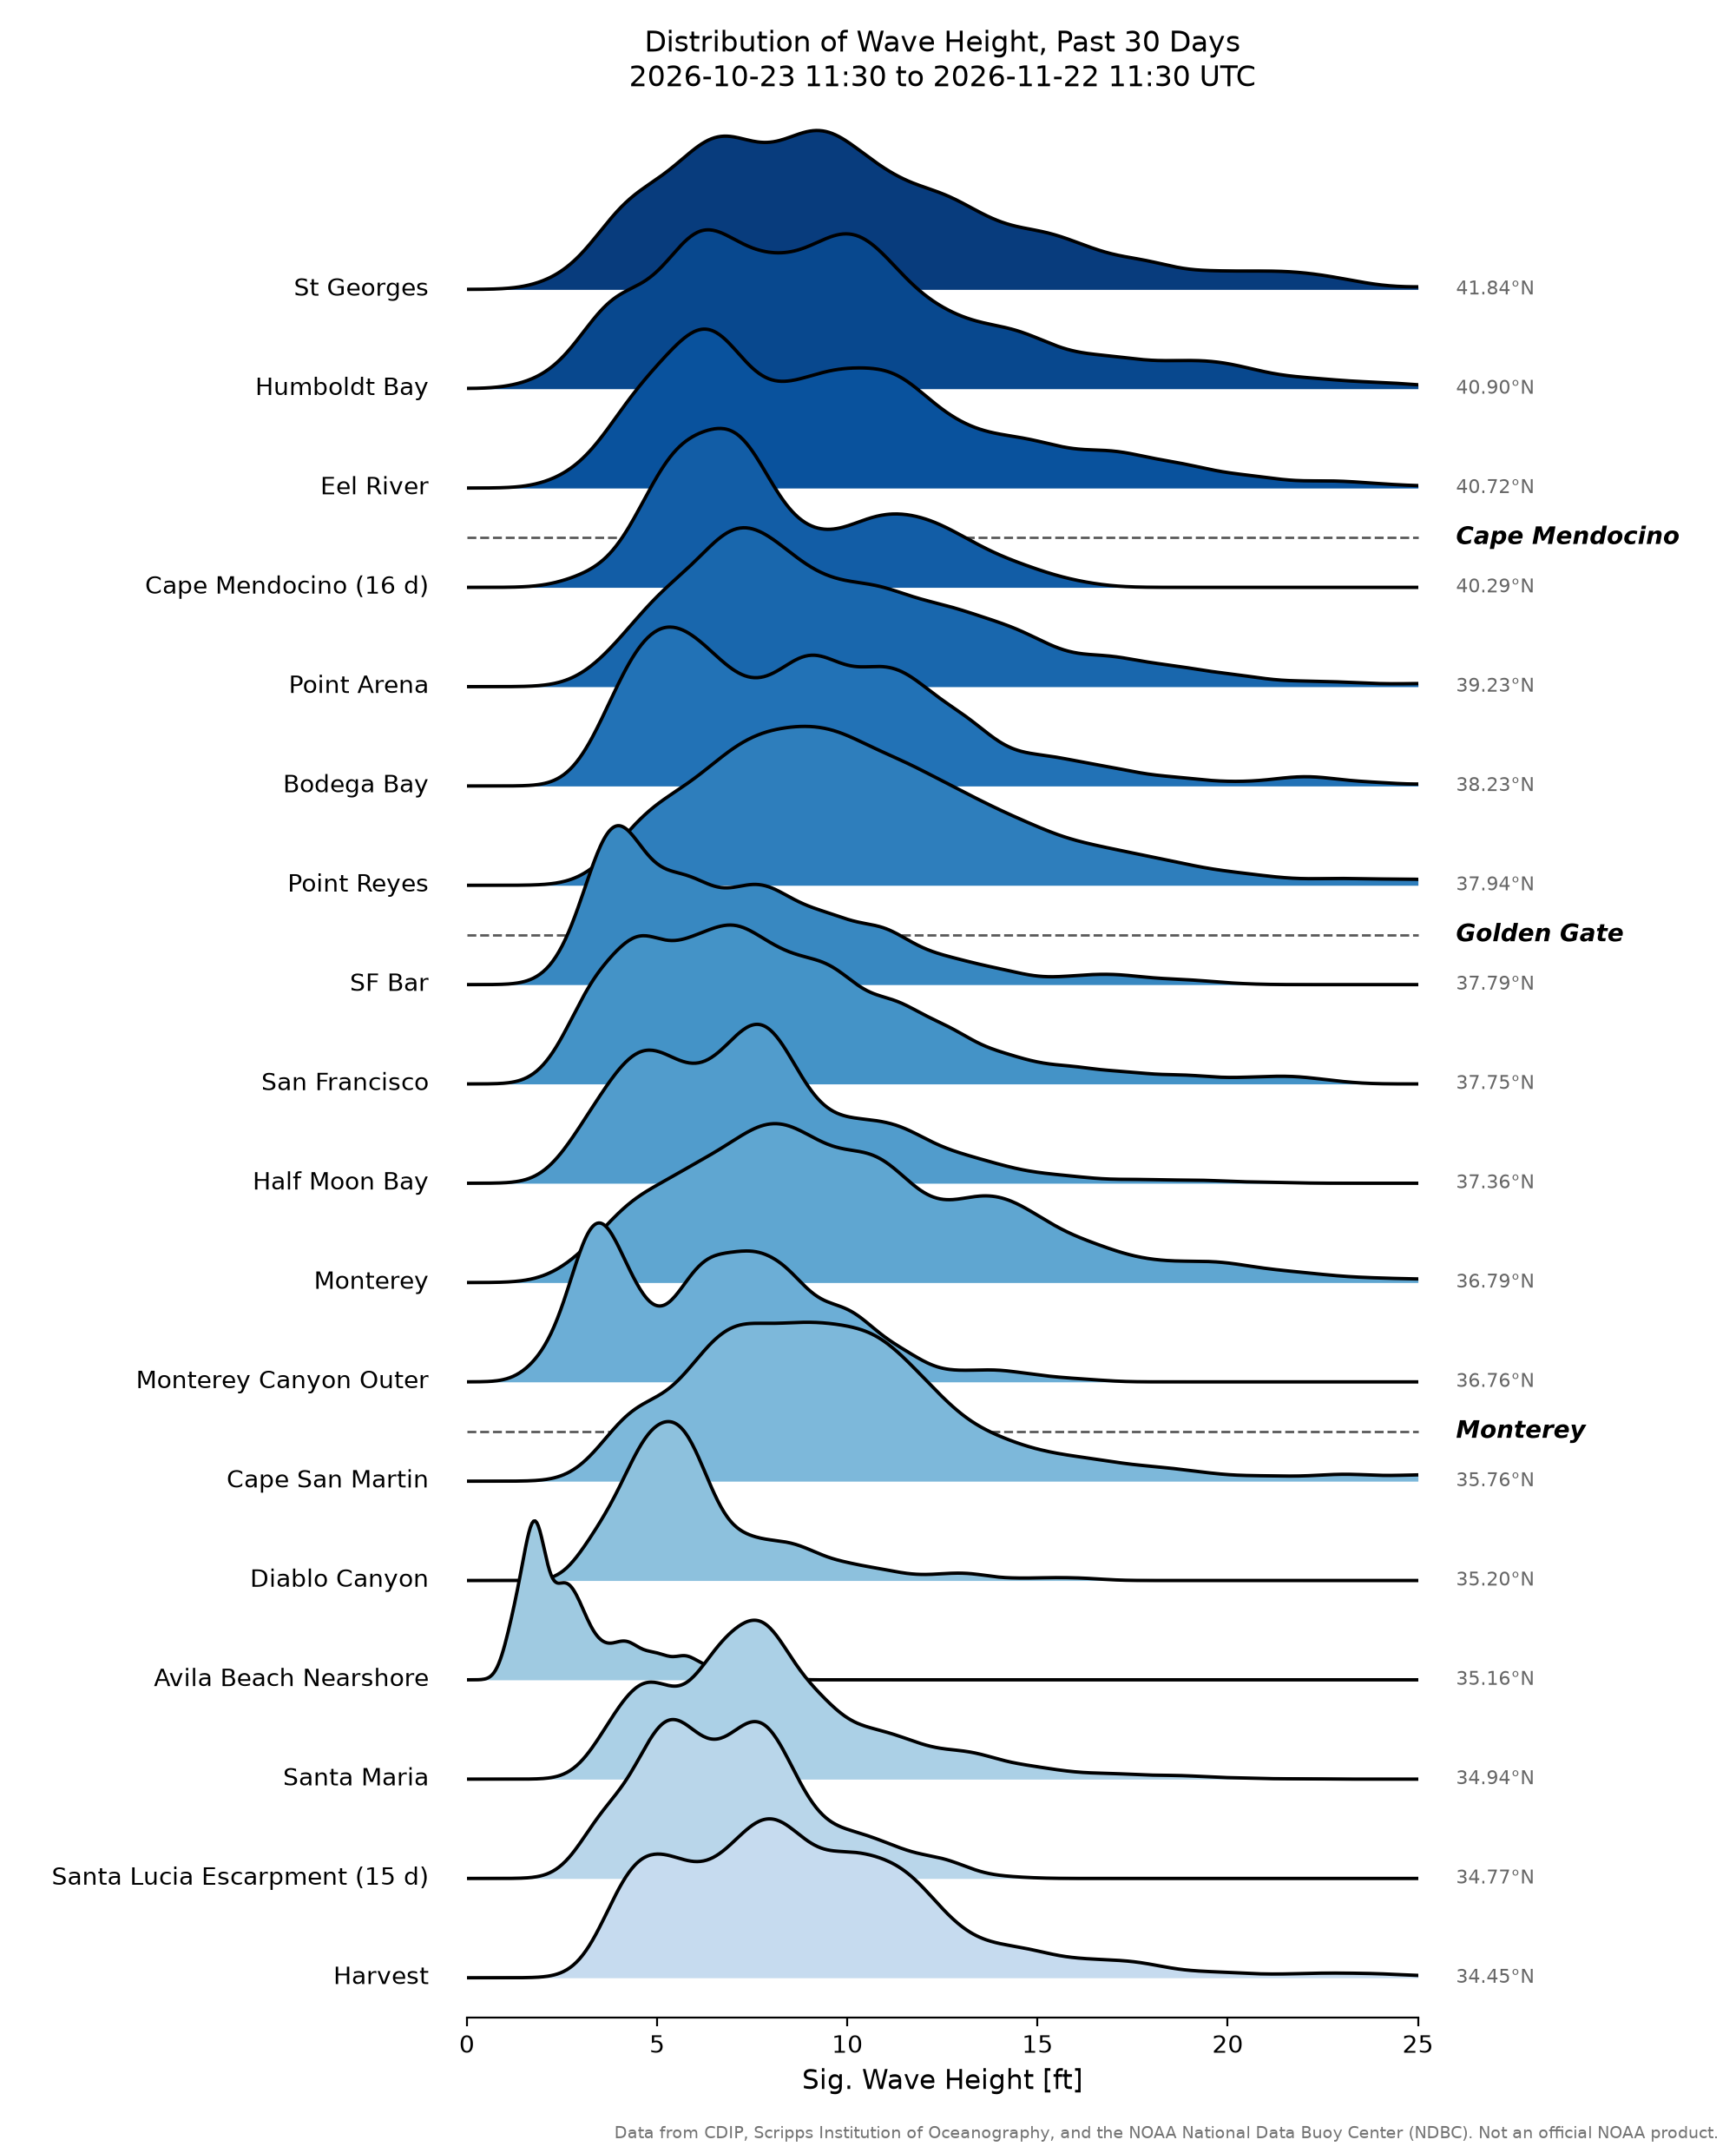
How to read it: This is a flat, single summary of the full past month. Wave height (0–25 ft) runs along the horizontal axis, and the ridges are stacked by latitude, with the northernmost buoy at the top and the southernmost at the bottom. A buoy with less than 30 days of data has its number of days in parentheses after its name, for example “(19 d)”. Its ridge represents a shorter period, so compare it with the others cautiously. Three features of each ridge are worth comparing:
- Peak position: the most common wave height at that buoy over the month. A peak farther to the right means a generally rougher site.
- Width: a narrow ridge means conditions were steady, and a wide ridge means they varied a lot.
- Right-hand tail: a long tail toward large heights records storm or swell events, even if they lasted only a day or two.
Compare the shapes and positions of the ridges rather than their absolute heights. Exposed offshore buoys tend to have broad ridges shifted to the right, while nearshore or sheltered buoys, such as Avila Beach Nearshore, have narrow ridges at low wave heights.
More about significant wave height
Where the idea came from
The idea dates to World War II, when oceanographers were developing wave forecasts for Allied amphibious landings. They needed a single number that matched what sailors reported when they judged waves by eye. Observers tended to notice the bigger waves and overlook the small ones, and their estimates turned out to align with an average height, trough to crest, of the highest one-third of the waves. That average became the definition of significant wave height.
How modern buoys measure it
Modern buoys reach the same number a different way. Instead of measuring waves one at a time, a buoy rides up and down on the surface for 20 to 30 minutes and records its motion. That record is then sorted into a wave spectrum, which shows how much energy the waves carry at each wave period, from short, choppy wind waves to long, rolling swell.
Adding up the energy across the whole spectrum gives one number, called the zeroth moment, m0. In this case, m0 measures the total variance (ie vertical displacement or up and down movement) of wave energy at different frequencies. Here, wave energy is roughly proportional to the distance the surface rises or falls (i.e. displaced), squared. And, for the random mix of waves found at sea, the average of the highest third of waves works out to about four times m0, which gives:
Hm0 = 4√m0
The subscript “m0” simply indicates that the value was calculated from the spectrum. For ordinary ocean waves it agrees closely with Sverdrup and Munk’s highest-one-third definition, so the two are both reported as significant wave height.
This entire concept is further complicated by the fact that those random waves can and are often coming from different directions. A swell could be generated thousands of miles away, while local weather may create wind-waves moving in different directions. So for each band in the wave energy spectrum, there is also a directional spectrum that shows the direction of energy at different frequencies. This also means that there are an infinite combination of ways to generate a value for significant wave height.
Further reading
For more detail on the calculation, see NDBC’s explanation of how wave height is calculated and CDIP’s Wave Measurement and FAQ pages. For a very readable introduction to how waves form, travel, are measured and shape the coast, and the history that shaped modern coastal engineering, we recommend Willard Bascom’s classic Waves and Beaches: The Dynamics of the Ocean Surface.
About the data
Wave data come from the Scripps Institution of Oceanography’s Coastal Data Information Program (CDIP) and the NOAA National Data Buoy Center (NDBC). Buoys marked ▲ in the animated plot are from the Backyard Buoys program, operated by the UC Davis Coastal Oceanography Group, and are used under a CC BY-NC 4.0 license. These are near-real-time observations that have not been fully quality controlled, and gaps mean a buoy was not reporting. The plots are for situational awareness, are not a forecast, and are not an official NOAA product. For marine safety, consult the National Weather Service marine forecasts.
Looking for an old plot?
Plots are archived daily here.