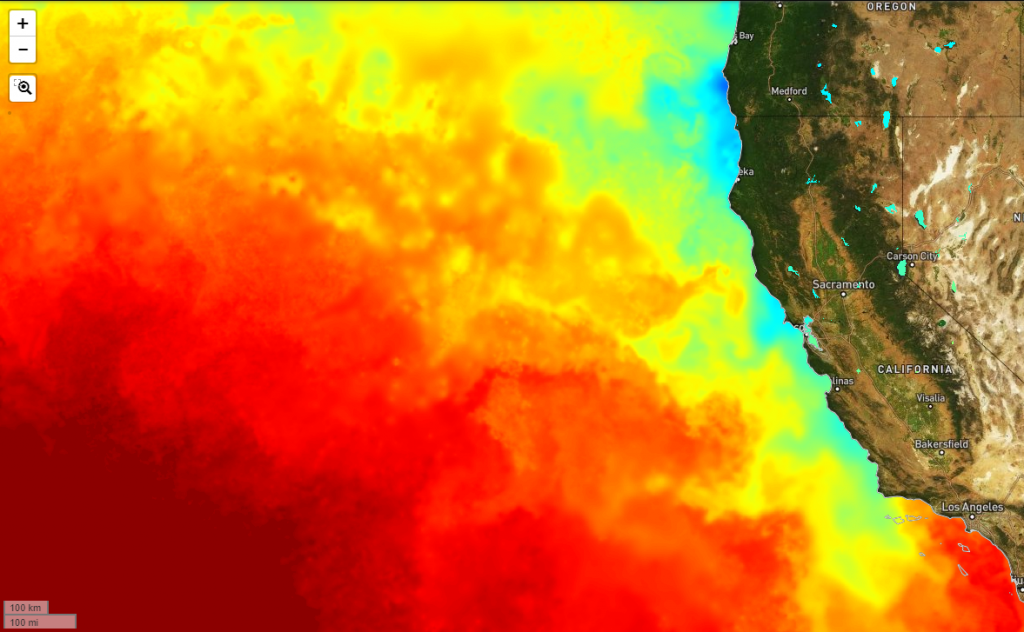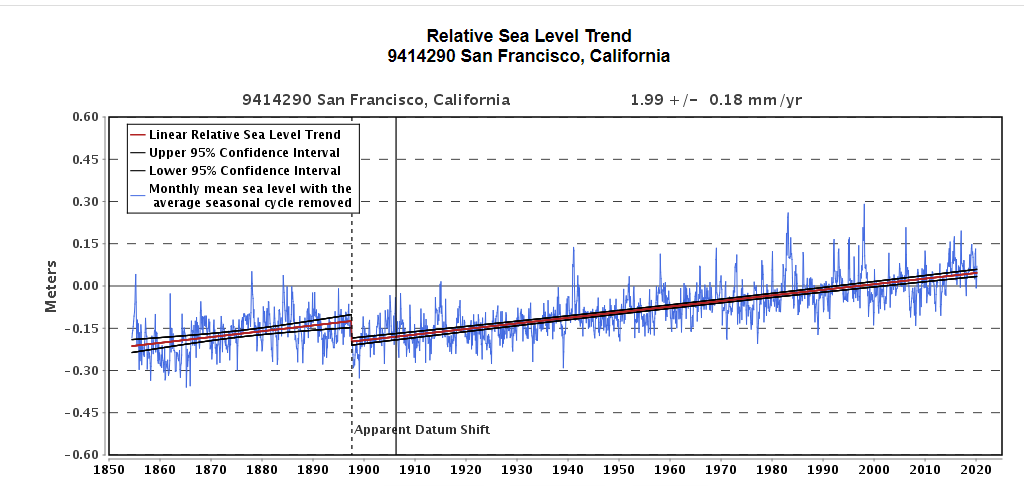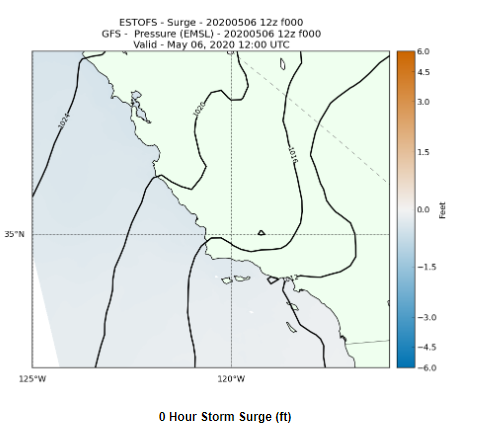
Changes and variability in climate and weather are fundamentally altering communities throughout coastal California, where more than 26 million people live, work, and play. Over time, these communities will be affected by rising sea levels, intensified storm surges, increased flooding, higher water temperatures, increased ocean acidification and deoxygenation, harmful algal blooms, and potentially even altering ocean currents and circulation patterns.
Detecting and understanding long-term change and variability in the environment are key to forecasting how such changes will affect all sectors of society—from human health to the health of the ocean systems we rely on—and to planning effective mitigation and adaptation strategies. Long time series and extensive model data from CeNCOOS and our partners underpin high-quality ocean and atmosphere forecasts, while also serving as a foundational record for understanding the consequences of anthropogenic change.
Rising to Meet the Challenge
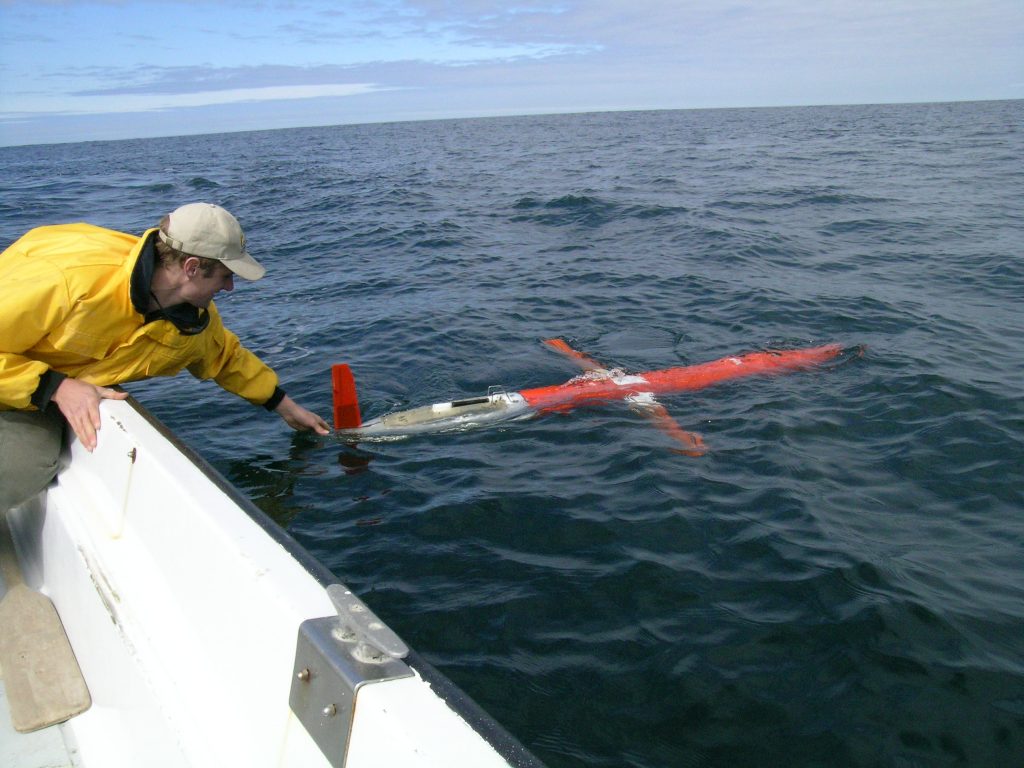
CeNCOOS makes improvements and upgrades to the observing system, including equipment recapitalization, to ensure data quality and system reliability. We fill gaps in observations, sensors, samplers, and platforms – including optical sensors, autonomous platforms, animal tags, and acoustics – to better support evolving regional priorities. We are Improving the quality and consistency of observations for understanding both short-term variation and more subtle long-term changes in temperature, salinity, ocean currents, carbon dioxide, dissolved oxygen, and nutrients and integrate maturing, innovative, and efficient observing approaches into the CeNCOOS framework to deliver “climate quality” information.