The Coastal Upwelling Transport Index (CUTI, pronounced “cutie”) and the Biological Effective Upwelling Transport Index (BEUTI, pronounced “beauty”) are two new west coat upwelling indices. The indices are derived using ocean models, satellite data, and in situ data.
CUTI provides estimates of vertical transport near the coast. It was developed as a more accurate alternative to the “Bakun Index”.
BEUTI provides an estimate of the nitrate flux near the coast. This flux may be more relevant than upwelling strength for biological responses.
For more details of the calculation, how they differ from the Bakun Index and access to data files of CUTI and BEUTI see https://mjacox.com/upwelling-indicies
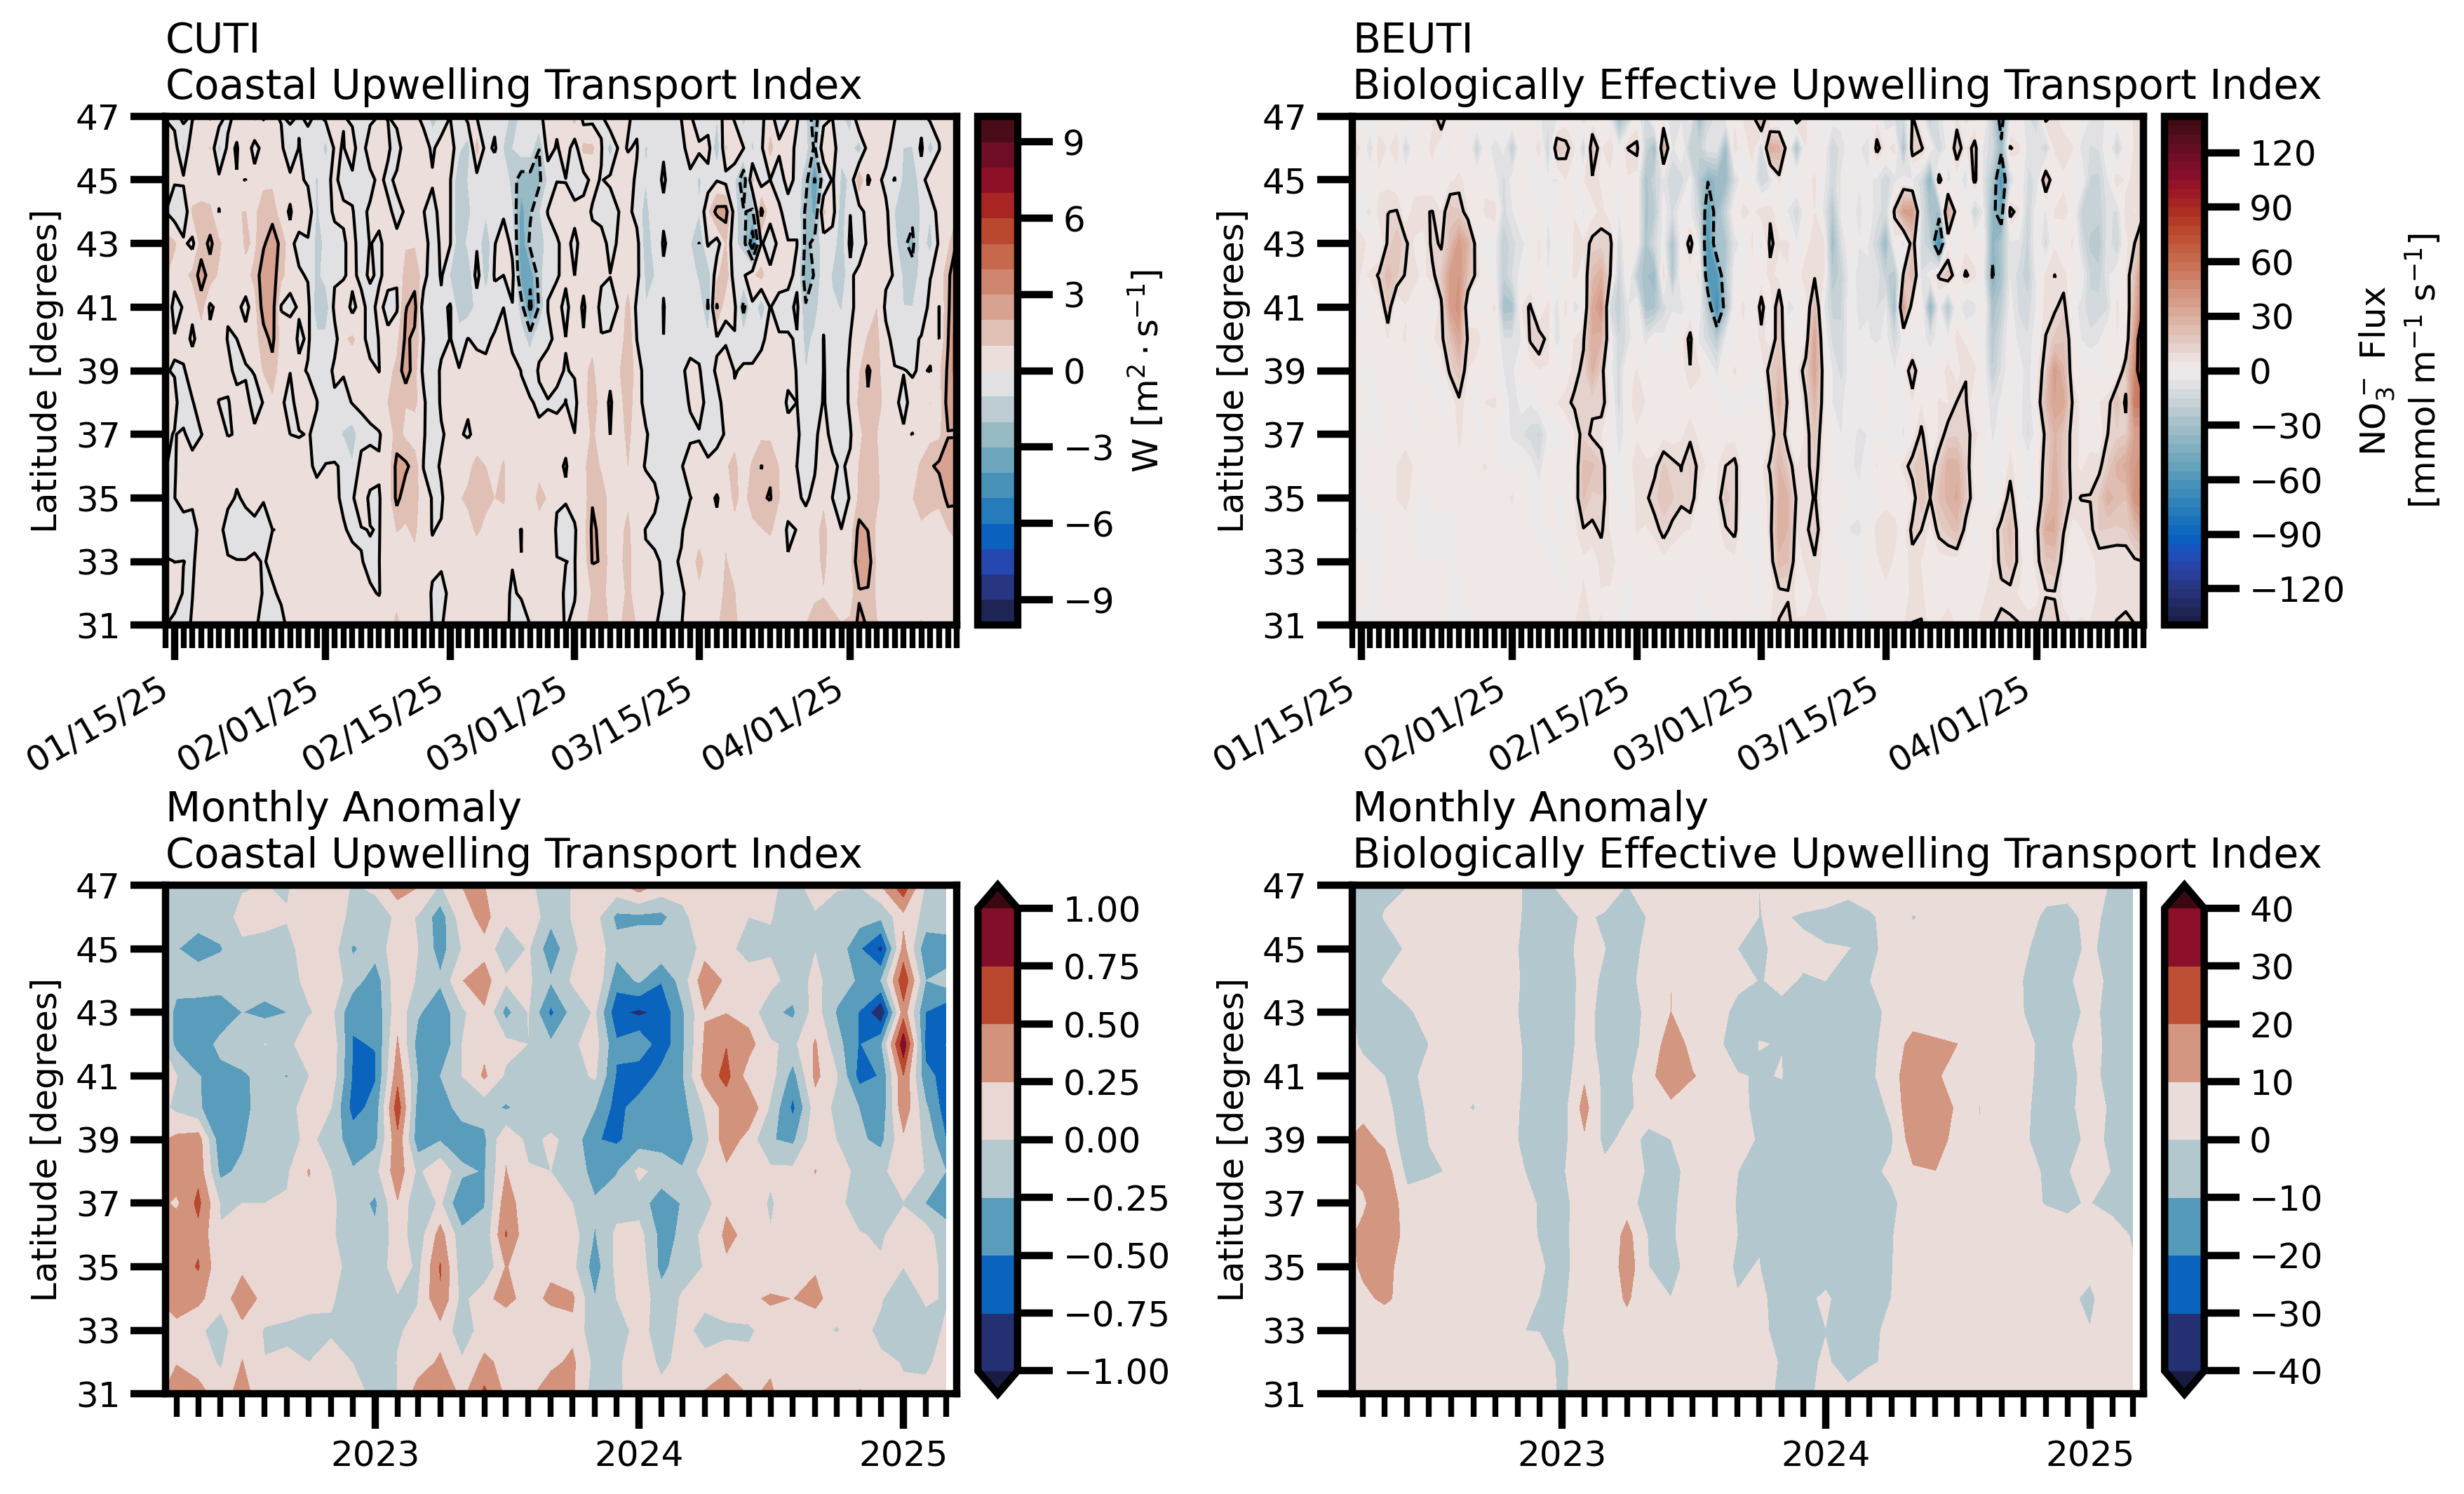
CUTI contours:
The more intense the red values the stronger the upwelling. The stronger blue colors the more the downwelling. The anomaly shows how the anomaly deviates from the climatological average. So positive (red) values show that there was more upwelling and negative (blue) values show that there was more downwelling than the climatological data. The black contour interval is for every 2 units. The upper panel is for the last 90 days and the lower panel is the monthly anomaly for the last 3 years.
BEUTI contours:
The more intense the red values the stronger upwelling of nitrate at the coast. The more intense the blue the stronger the downwelling of nitrate. The anomalies show the values again relative to climatology. The stronger the positive anomaly (red) the more nitrate is upwelled relative to a climatological average. The stronger the negative anomaly (blue) the lower the nitrate values relative to the climatological values. These would indicate less nitrate available for biology relative to the climatological values. The black contour interval is for every 50 units. The length of time for the upper and lower plots are as described above for the CUTI product.