There are a couple of ways to change the date range:
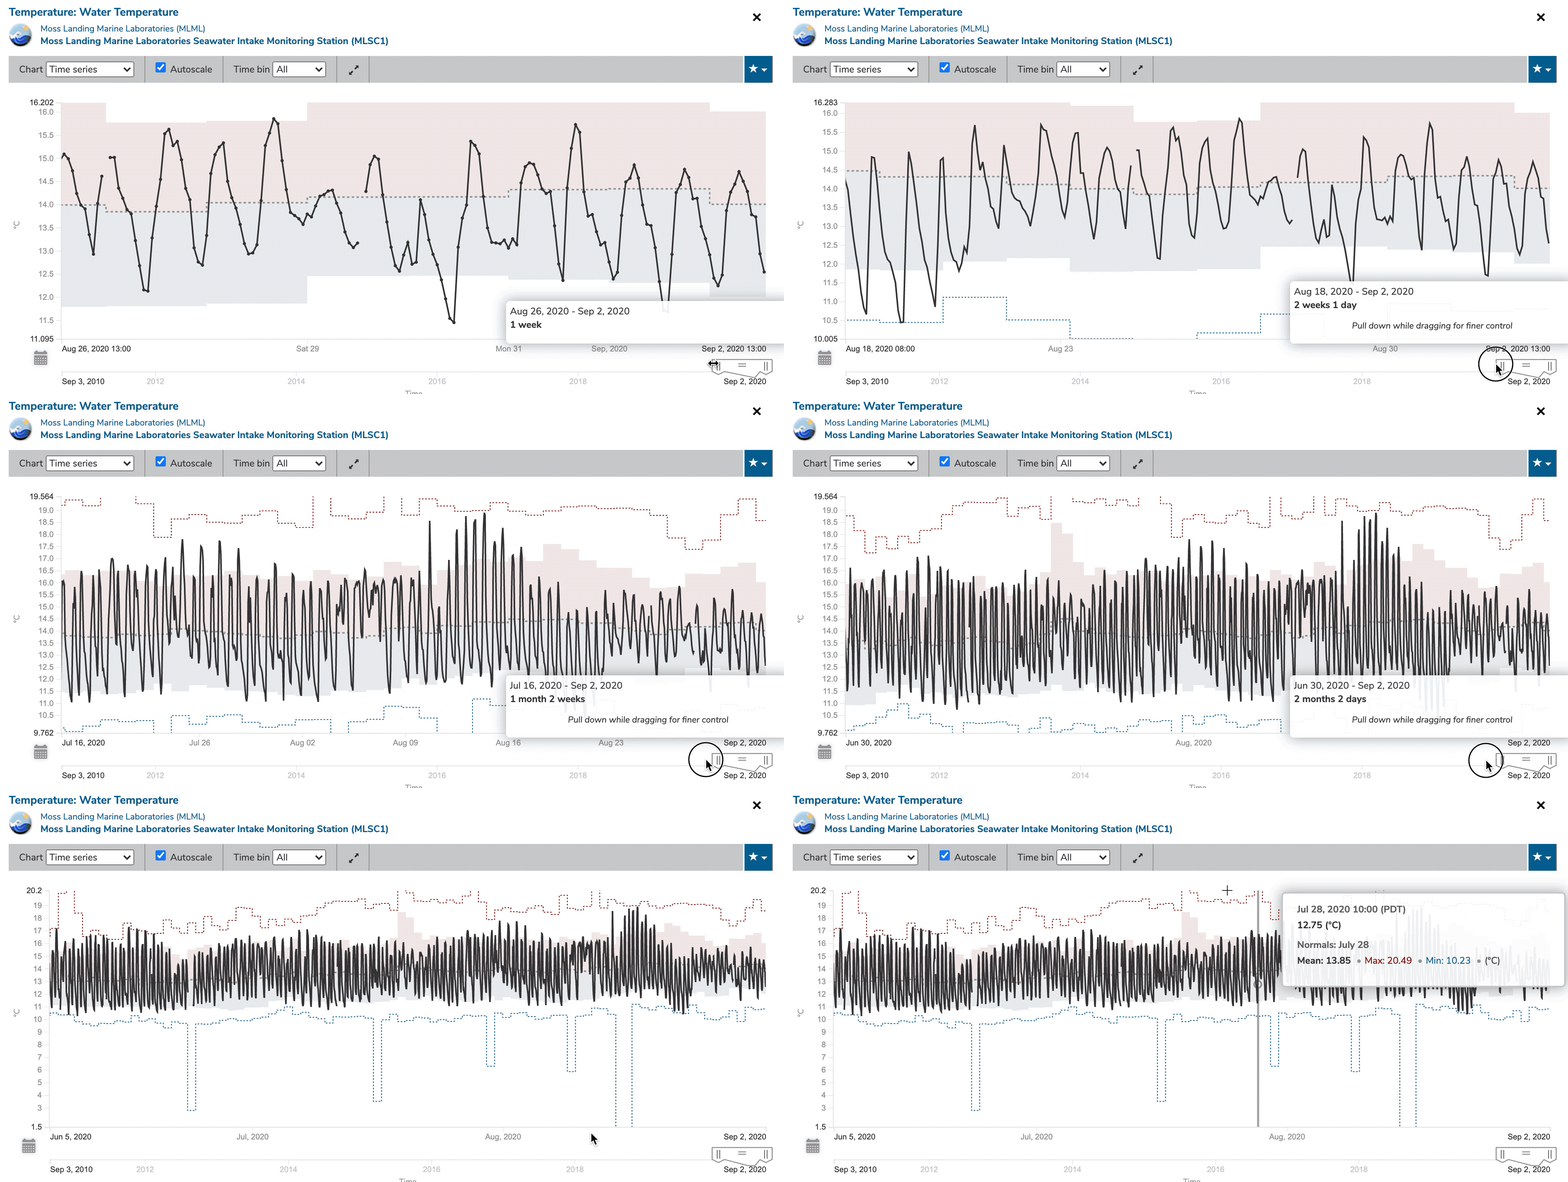
1. Adjusting the Slider – Click and drag the slider at the bottom right corner of the plot

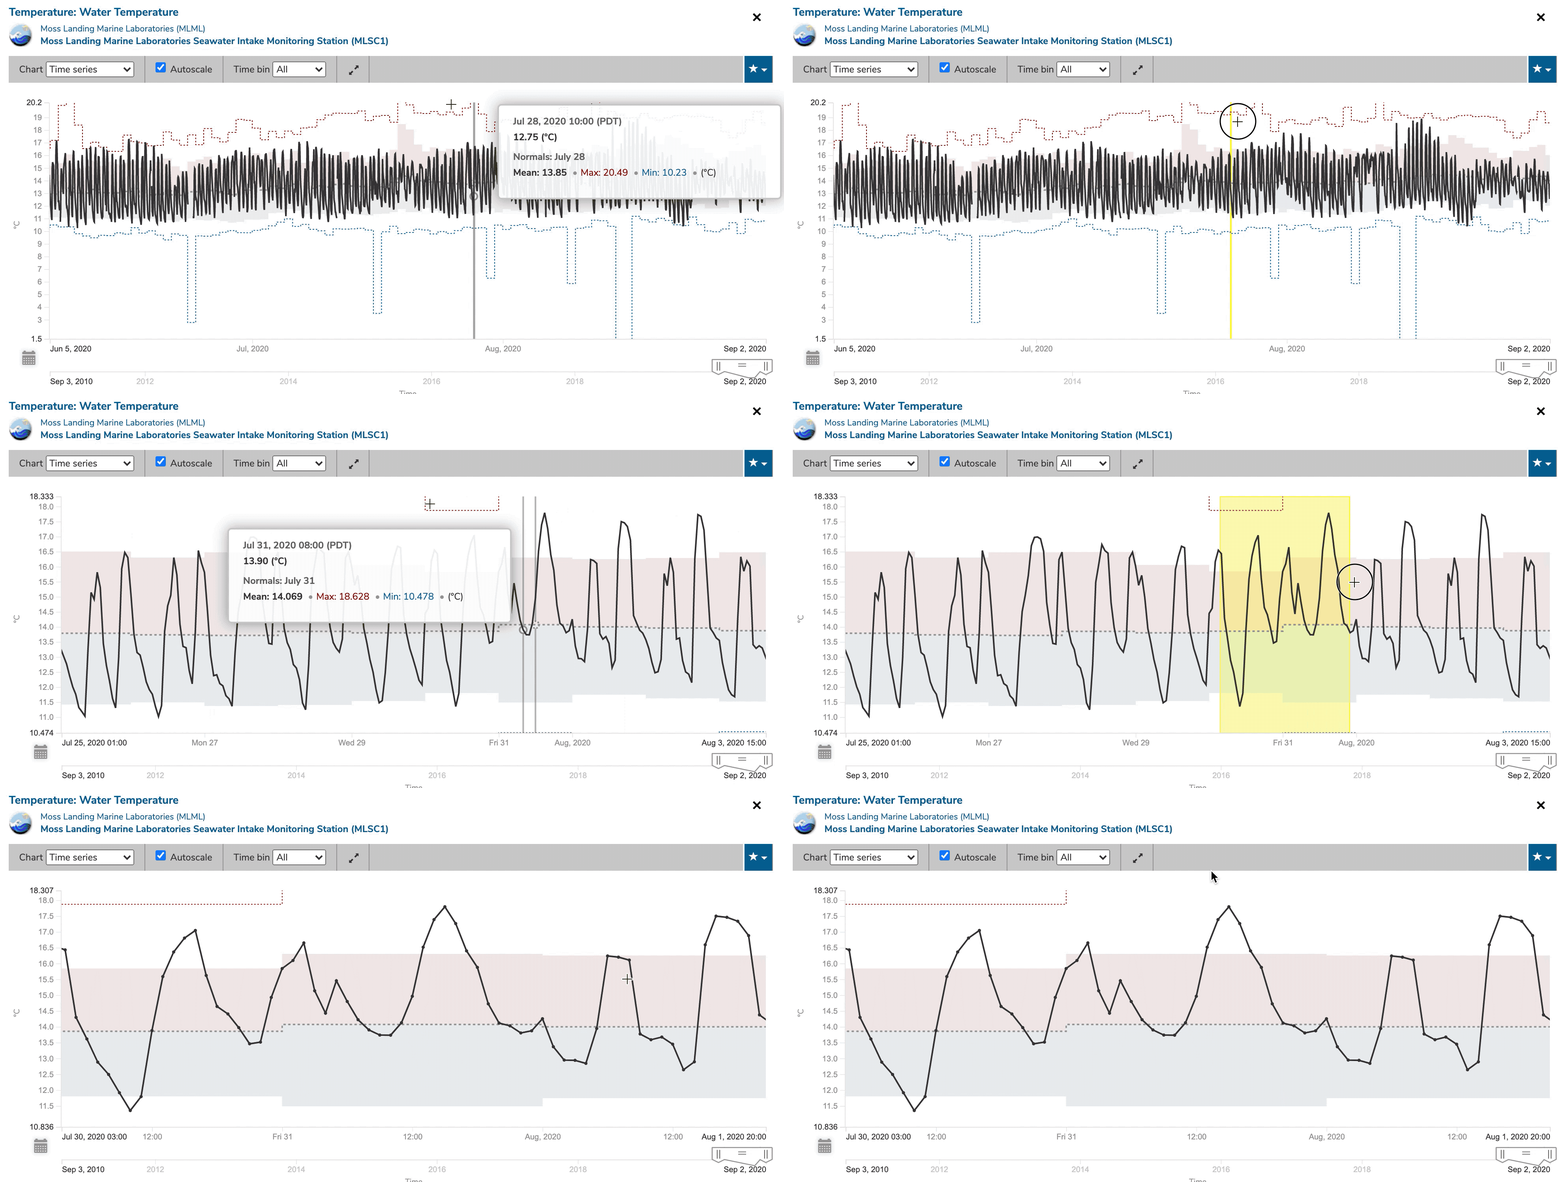
2. Click and Dragging over the Pl
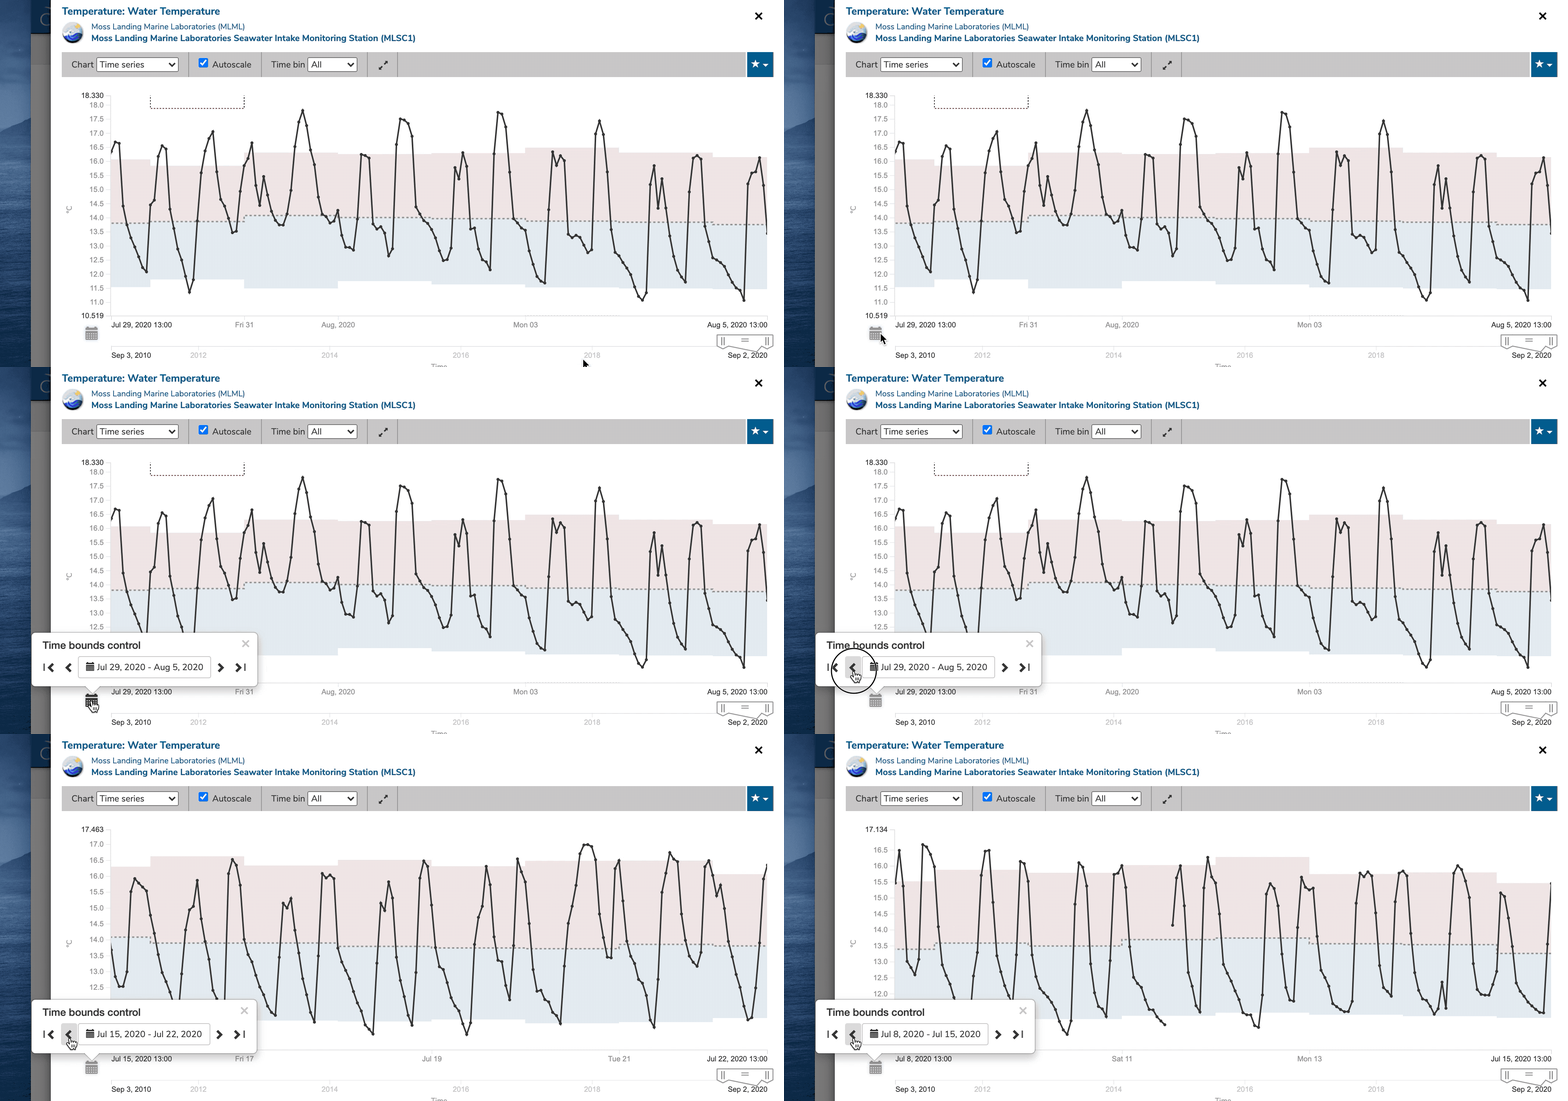
3. Using the Time Bounds Controls – Click on the Calendar Icon ![]() on the bottom left corner and click on the Arrows.
on the bottom left corner and click on the Arrows.
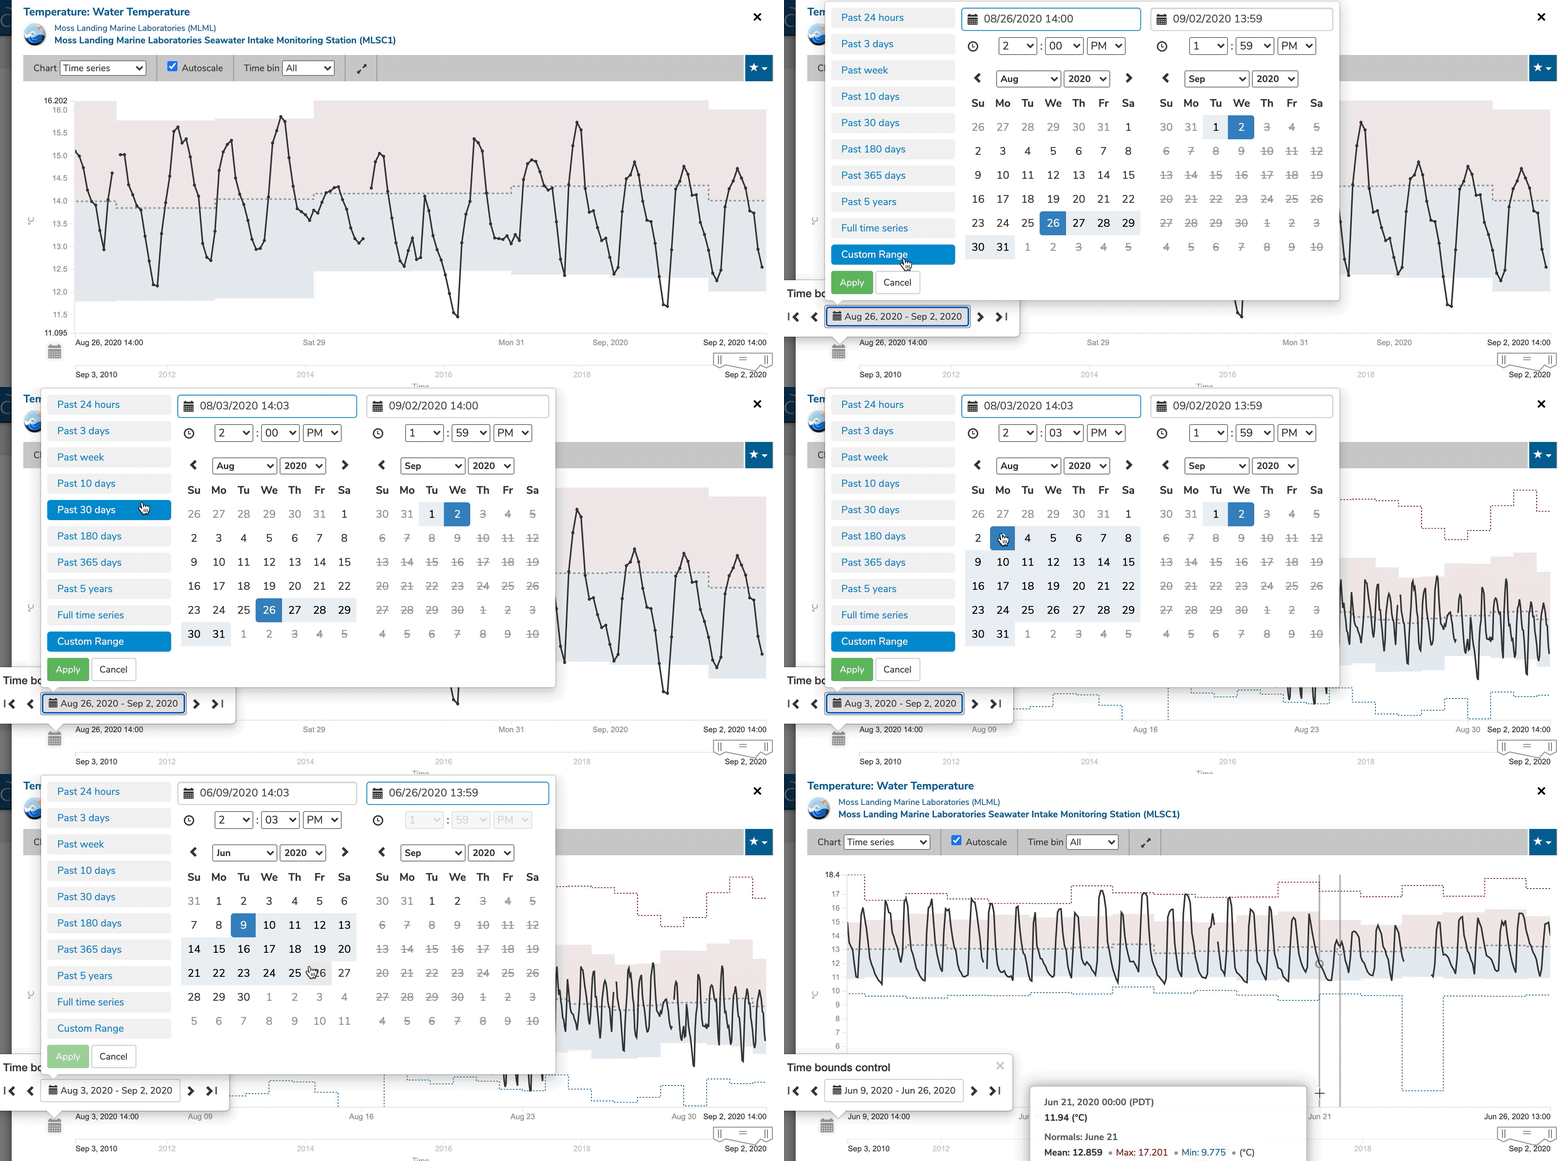
4. Selecting Custom Date Ranges – Click on the Calendar Icon ![]() on the bottom left corner, then click on the date to bring up the Calendar Page.
on the bottom left corner, then click on the date to bring up the Calendar Page.

