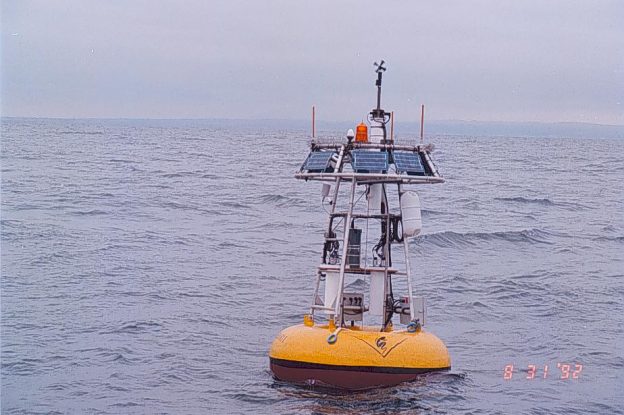
The Monterey Bay Aquarium Research Institute’s (MBARI) M1 buoy data plots
M1 QC notes for plots
If you use the data from the links below, please acknowledge Francisco Chavez and the Monterey Bay Aquarium Research Institute.
M1 historic NetCDF data files (_M(met data),_TMTS (subsurface microcat data), _ADCP (current data))
MBARI M1 historical deployment data access
| Incoming Atmospheric Radiation |
 |
 |
| Meteorological Variables (blue=metsys, green=hrh) |
 |
| Meteorological Variables (blue=metsys, green=hrh) |
 |
 |
 |
 |
| Surface and Subsurface Temperature and Salinity |
 |
| Temperature and Salinity (magenta sfc, red 10m orange 20m,green 40m,cyan 60m,blue 80m) |
 |
 |
| Temperature and Salinity (magenta 100m, red 150m orange 200m,green 250m,cyan 300m) |
 |
 |
| Subsurface Currents |
| ADCP profile (green=East/West, red=North/South) |
 |
 |
 |
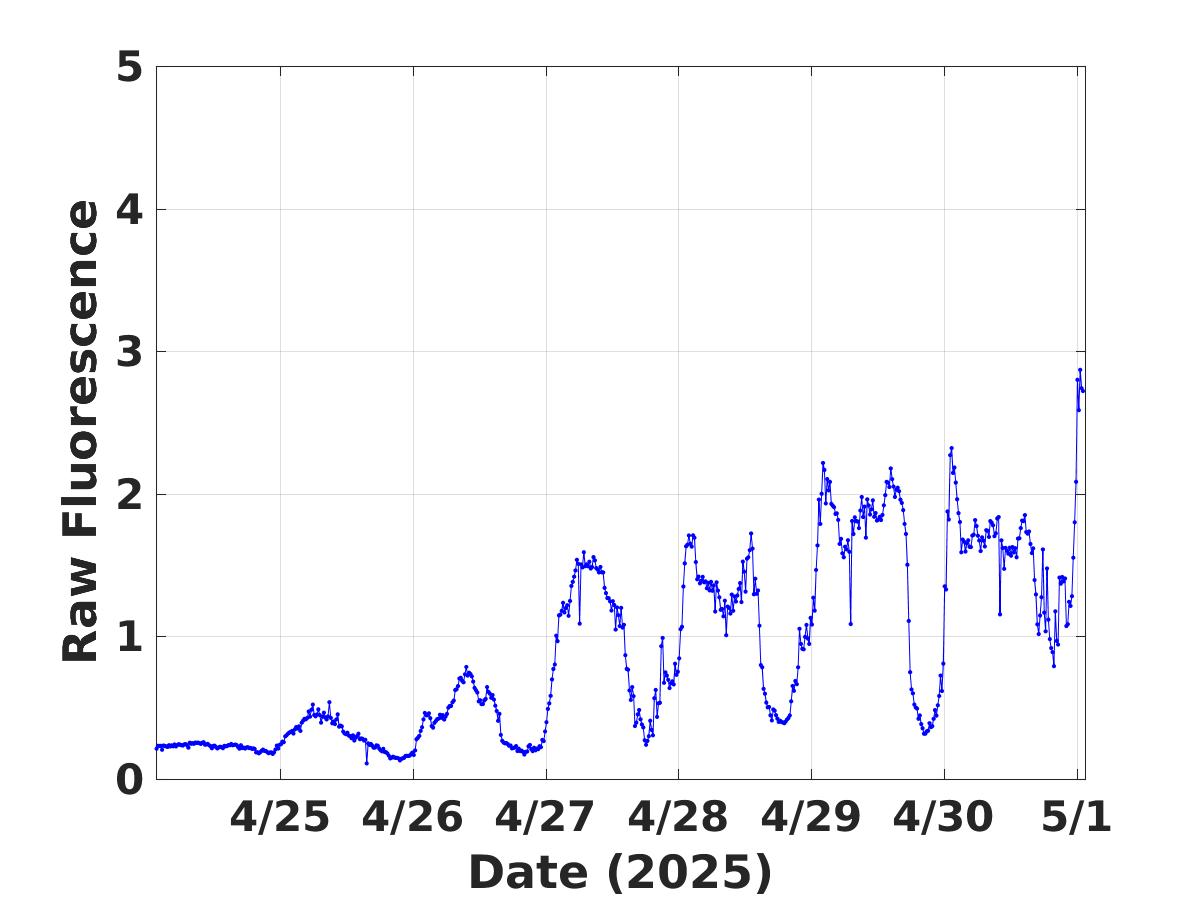
| Surface Fluorescence |
 |
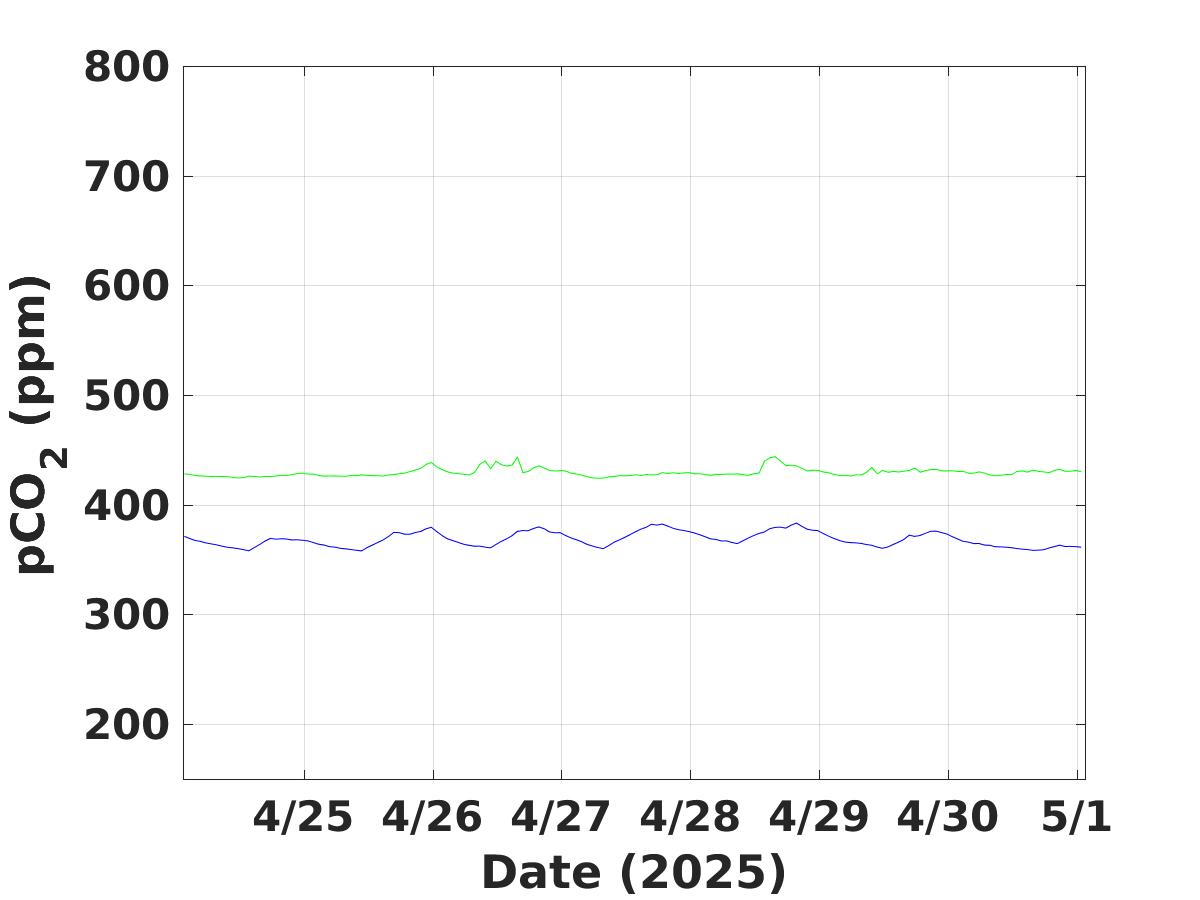
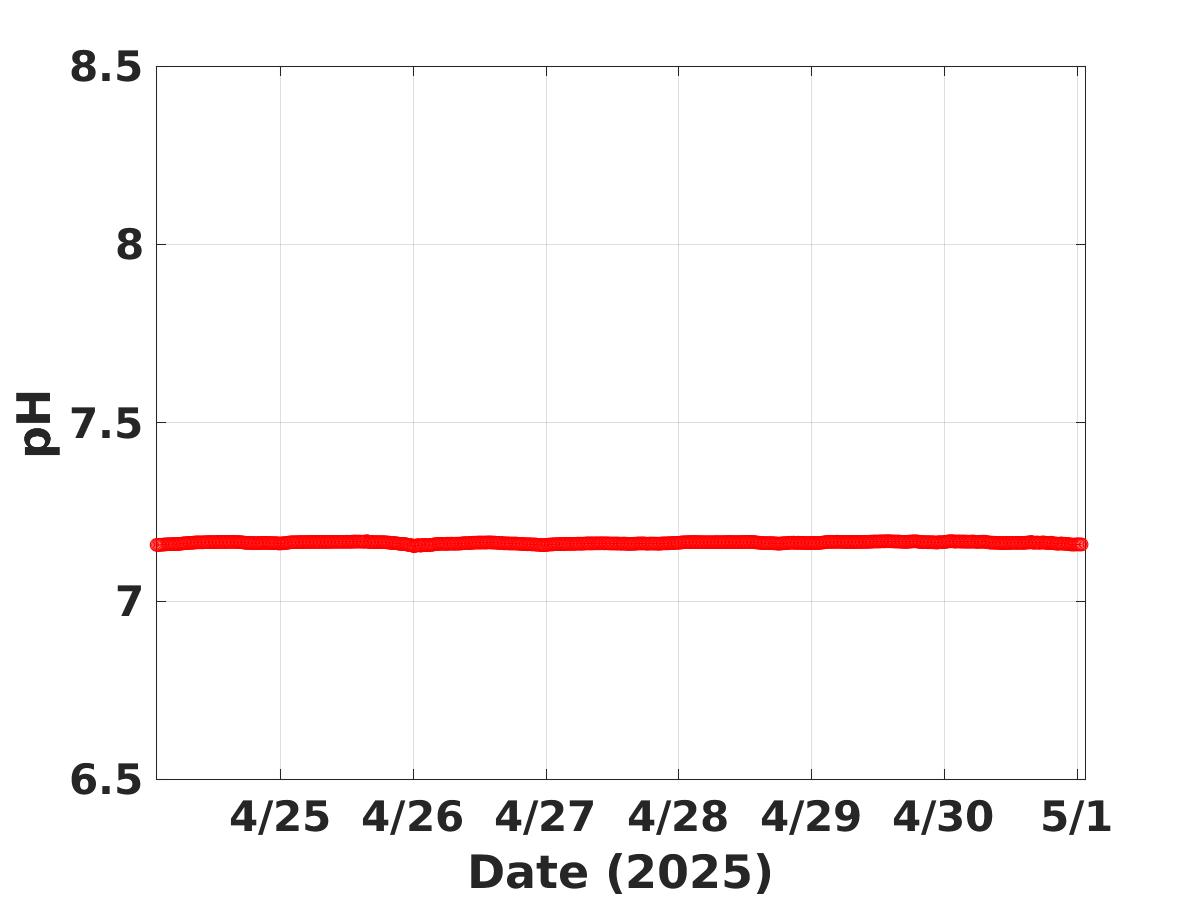
| Surface pCO2 and pH |
 |
 |
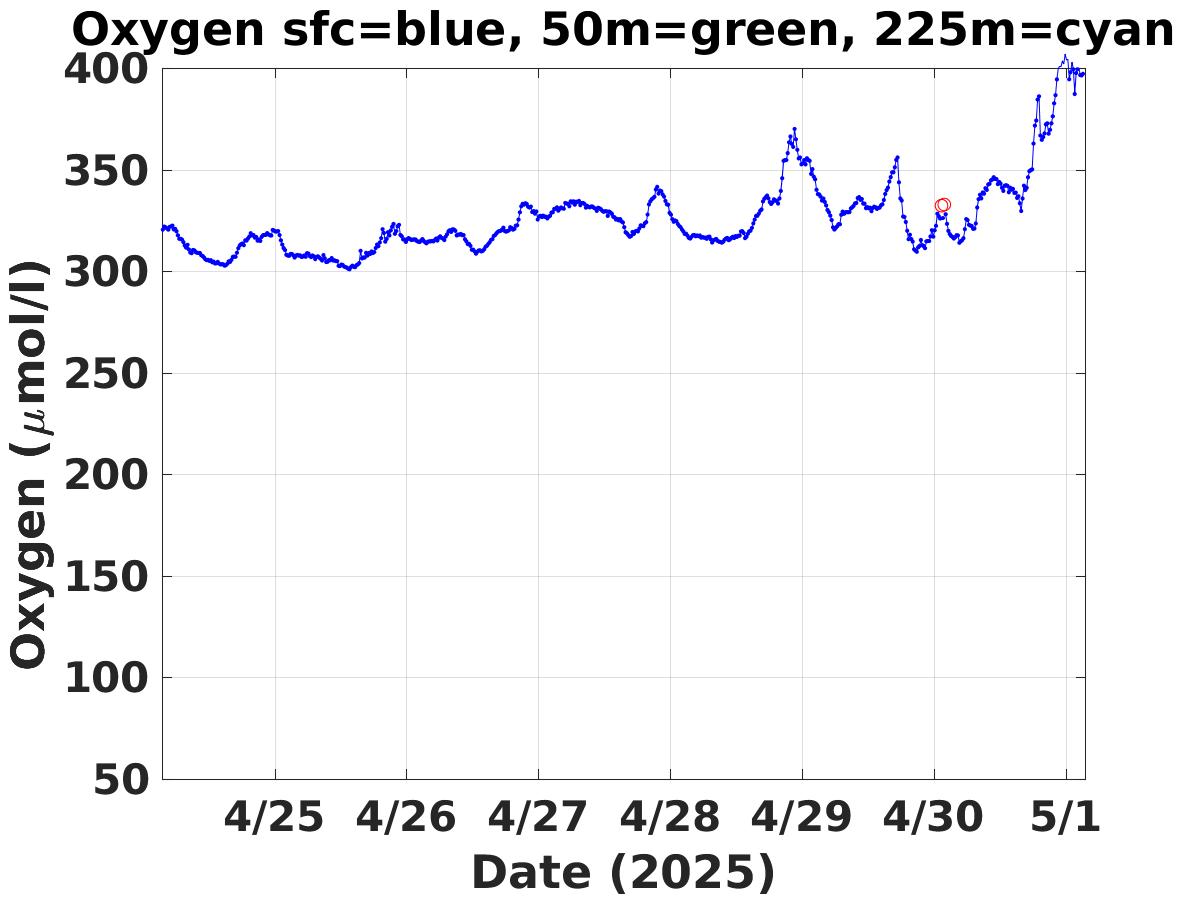
| Dissolved Oxygen |
 > > |