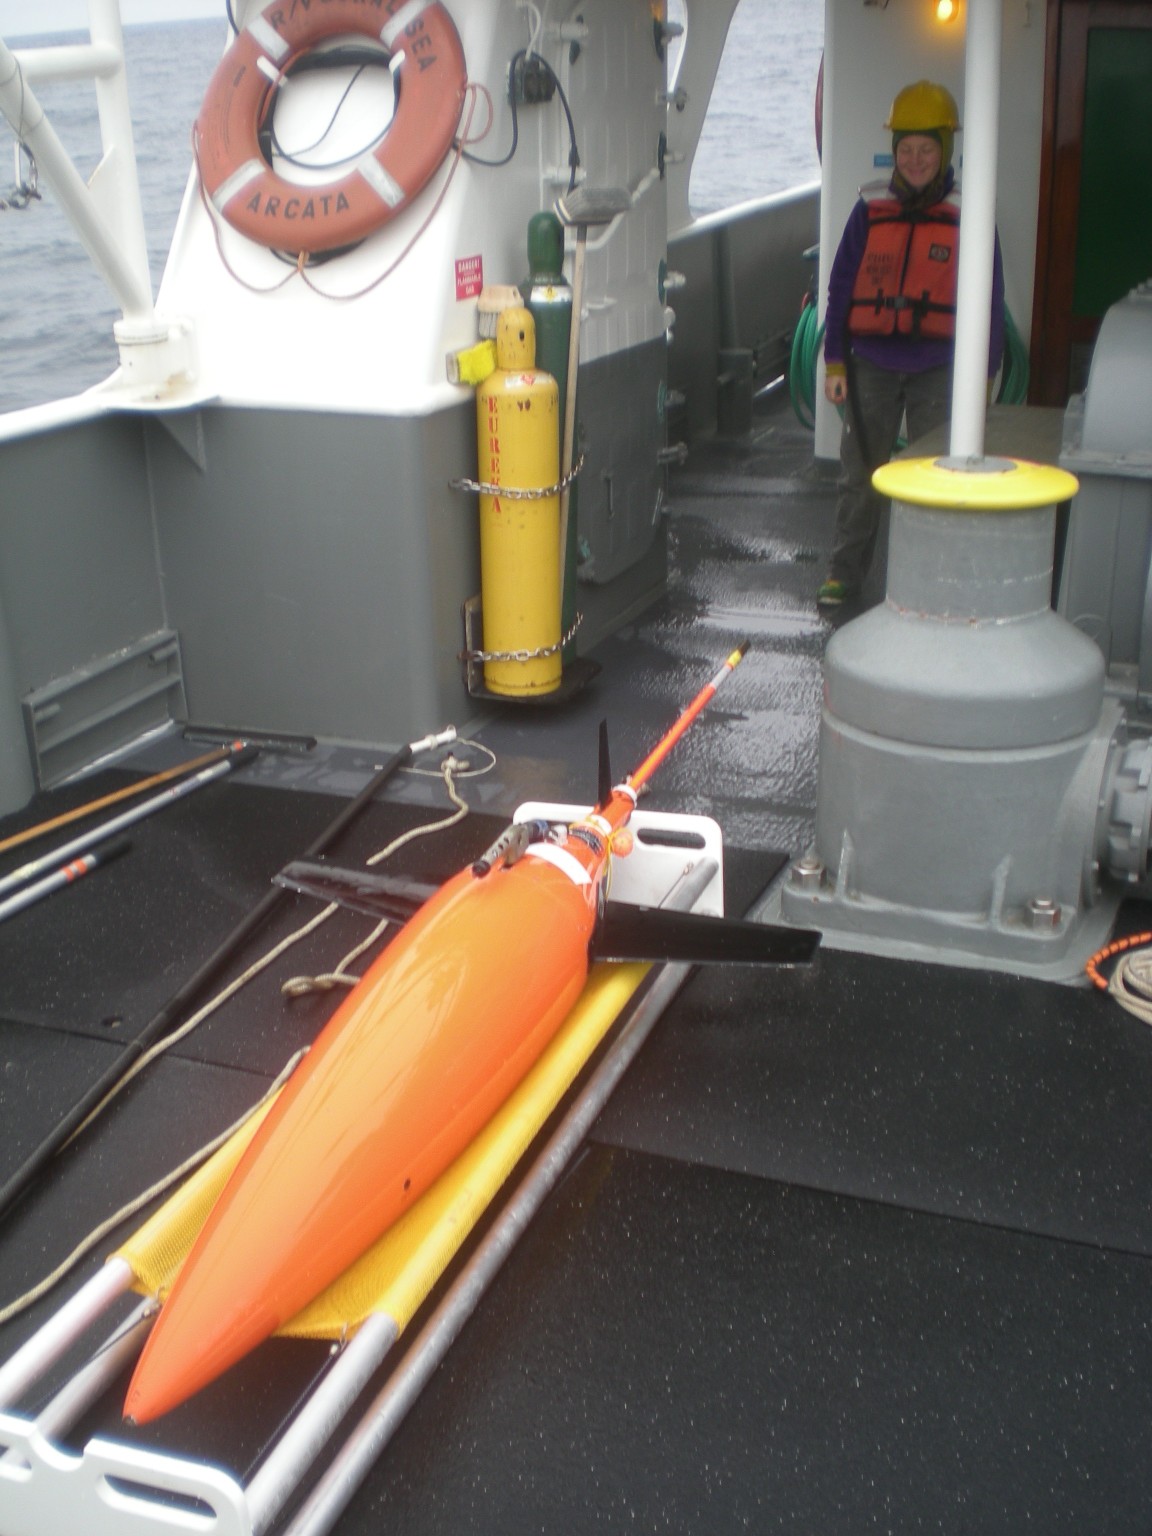
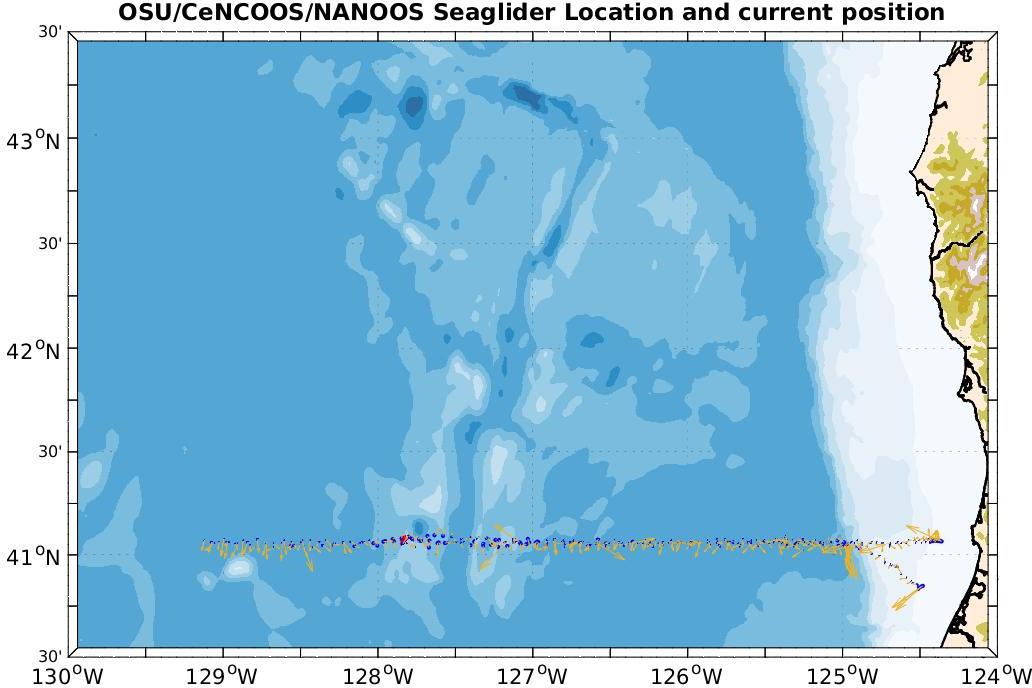
This glider continuously transects from approximately 10km offshore of Trinidad Head to about 300 km offshore, repeating the line every 15-20 days. Gliders have been collecting observations along this track since late 2014. The most recent data from the active mission is plotted below and soon data will be available for download from the IOOS Glider DAC.
Active Mission Plots
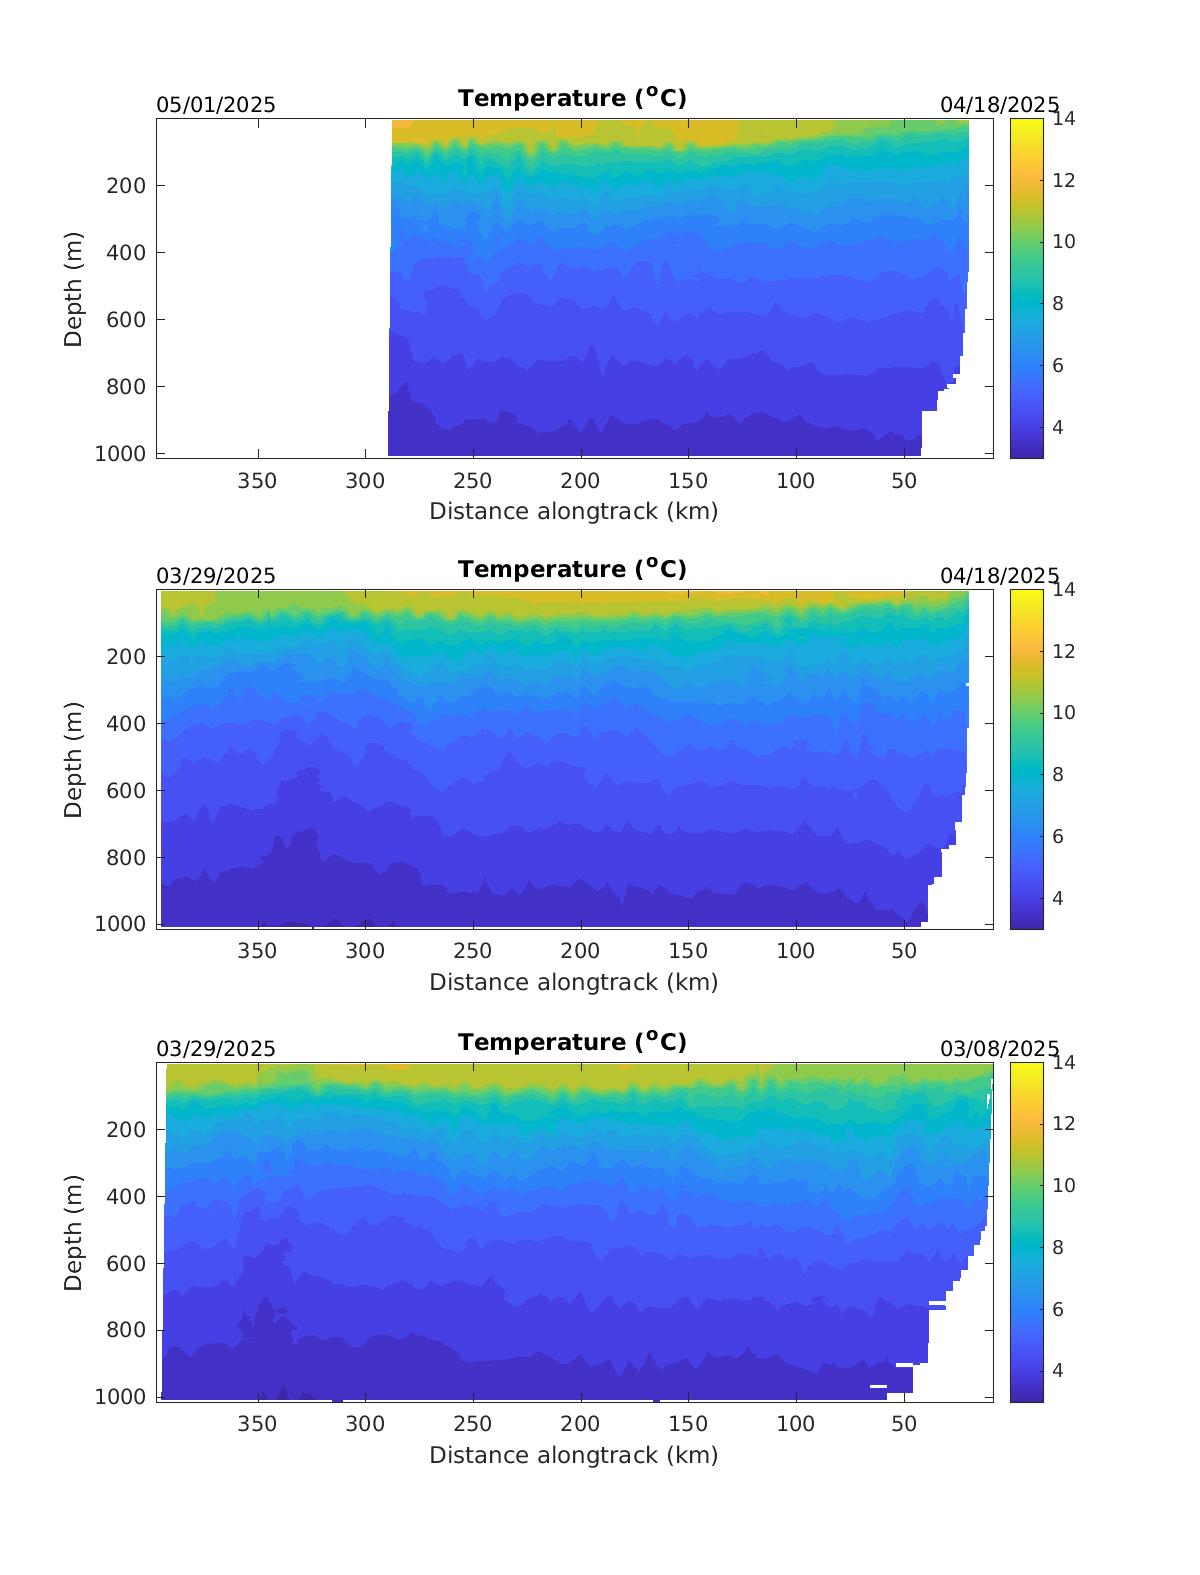
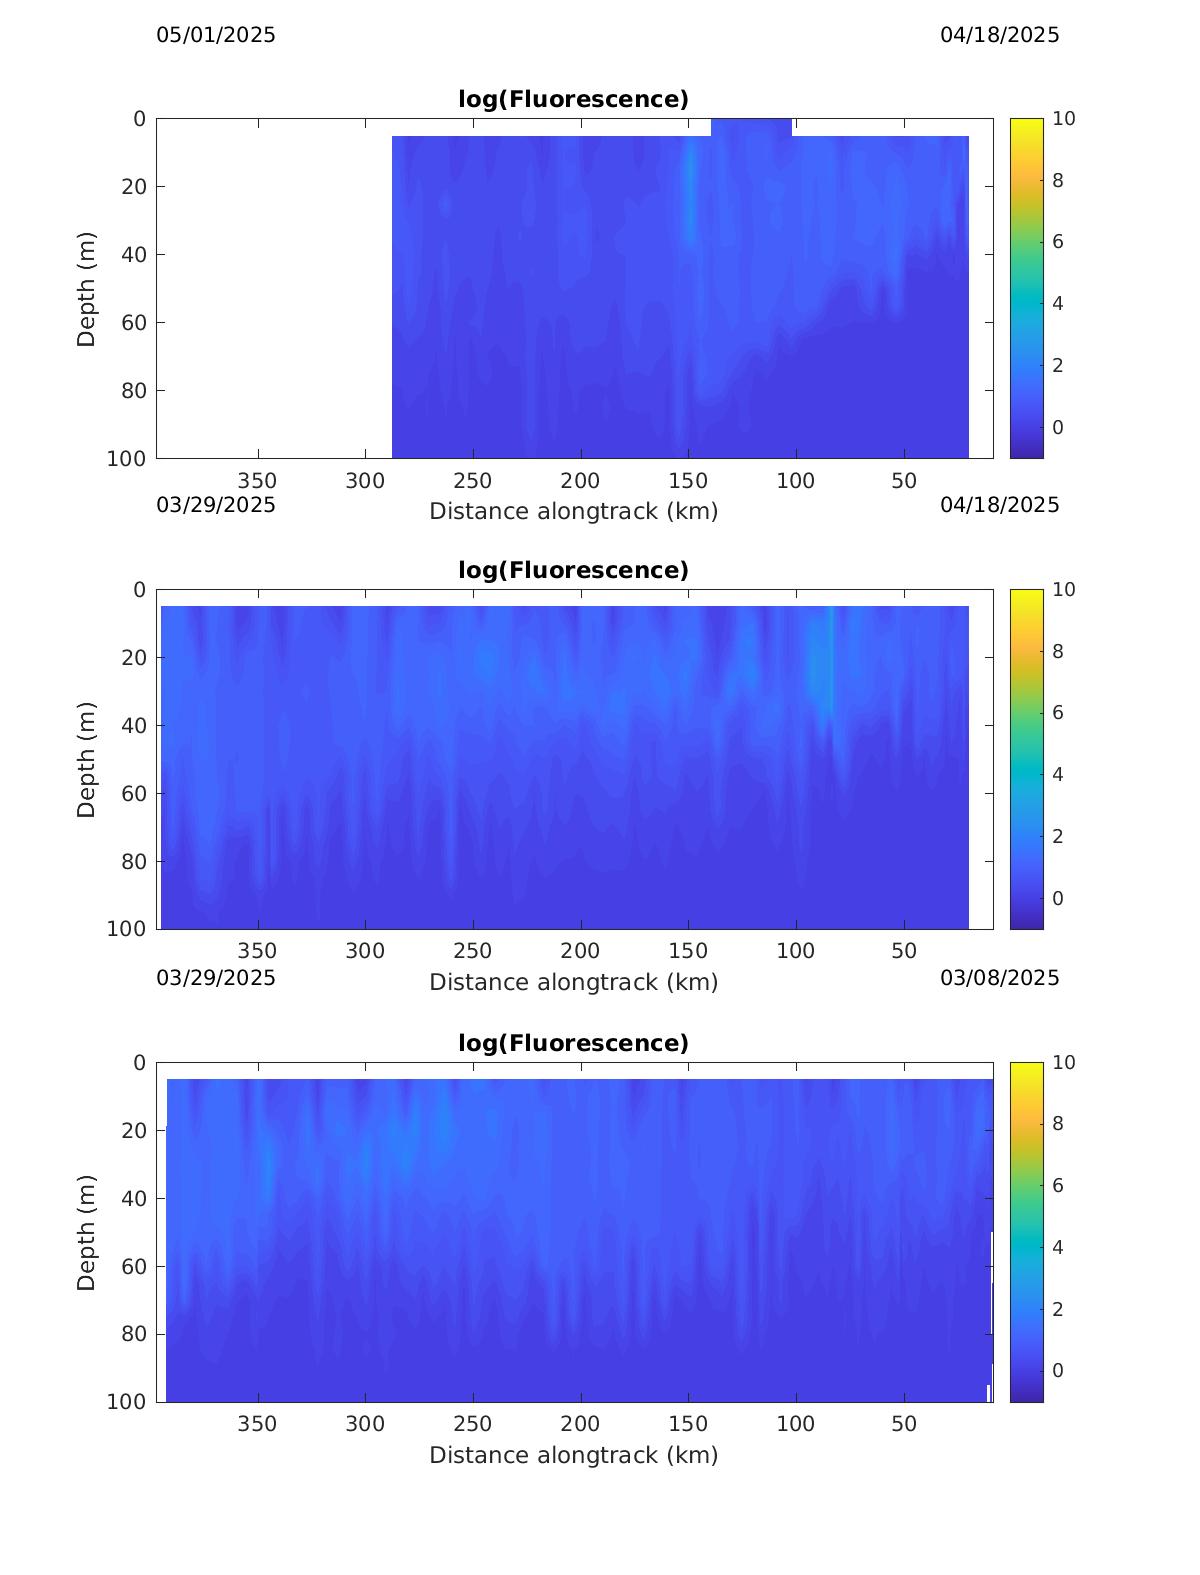
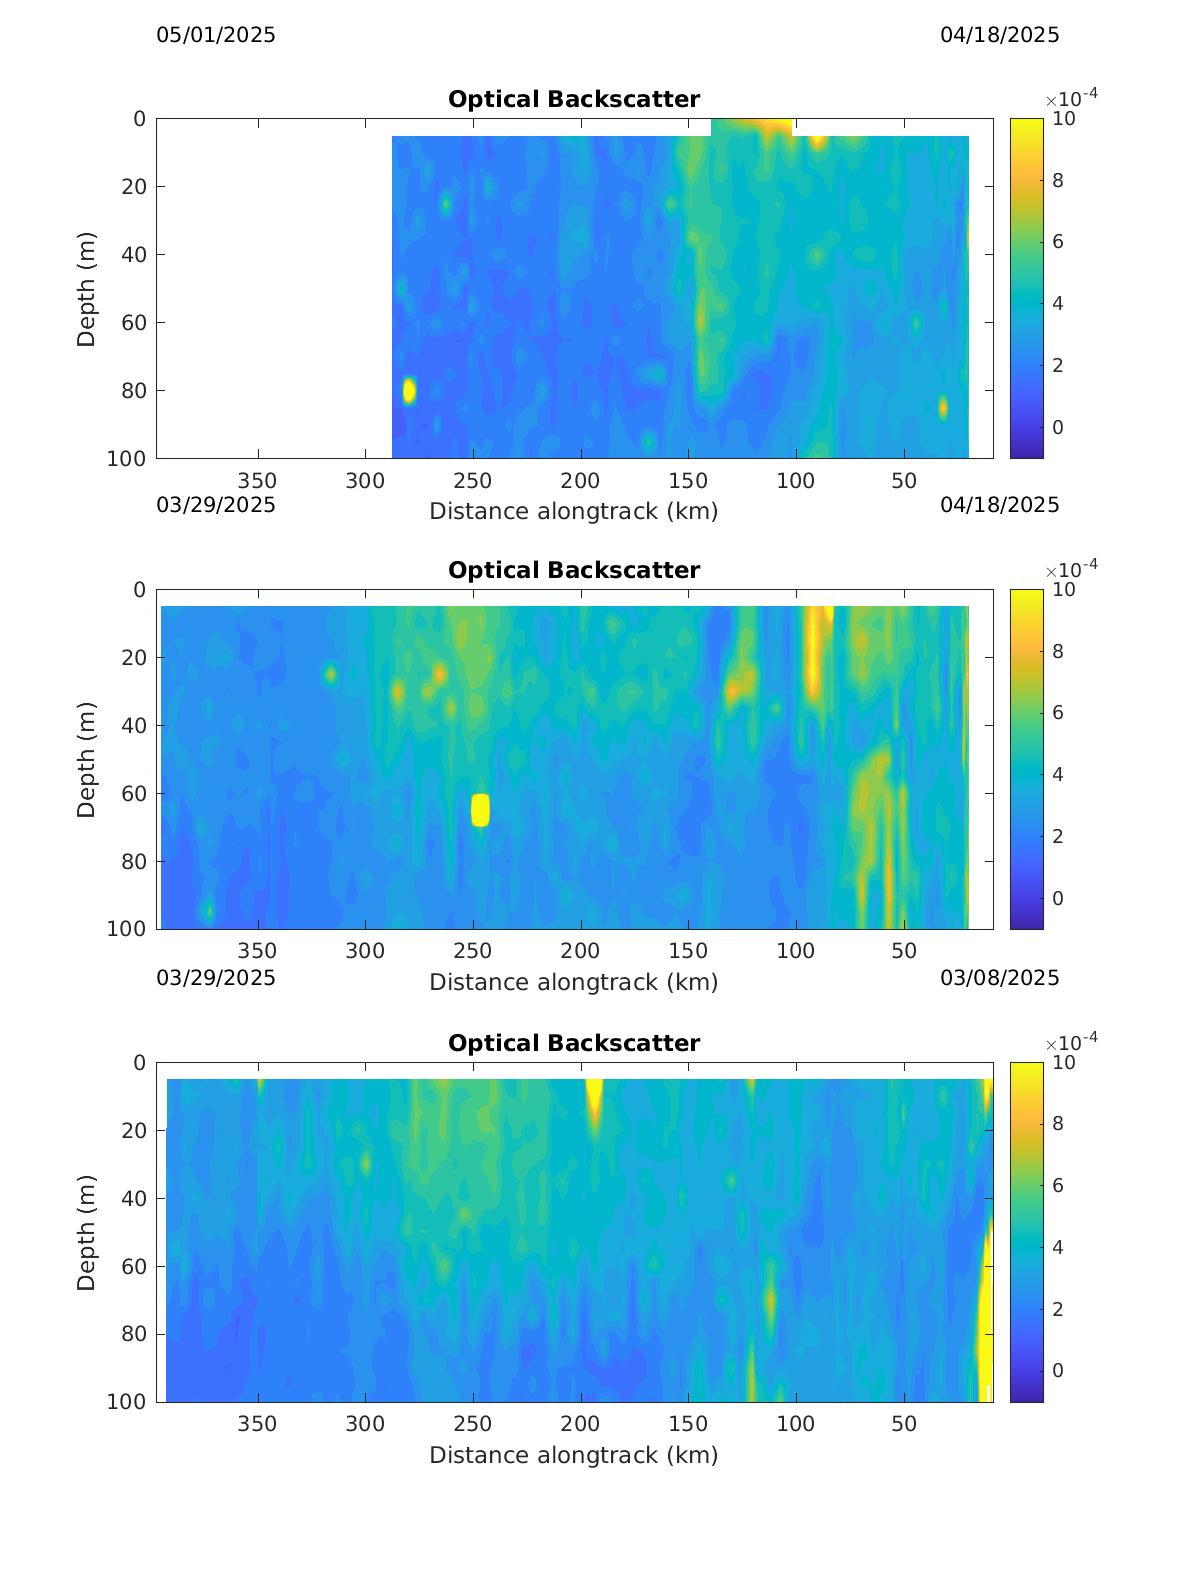
Plot Details: The contour plots below are updated every 4 hours and display water temperature, salinity, chlorophyll flourescence and acoustic backscatter from the surface to 500 meters depth. The top plot for each variable is the most recent glider transect. The dates on the top axis of plot provide a reference to the start and end time of that stretch of data. The x-axis on each plot represents the distance along the track and indicate the glider’s direction (towards or away from shore). Learn more about how to interpret glider contour plots
Temperature
Salinity

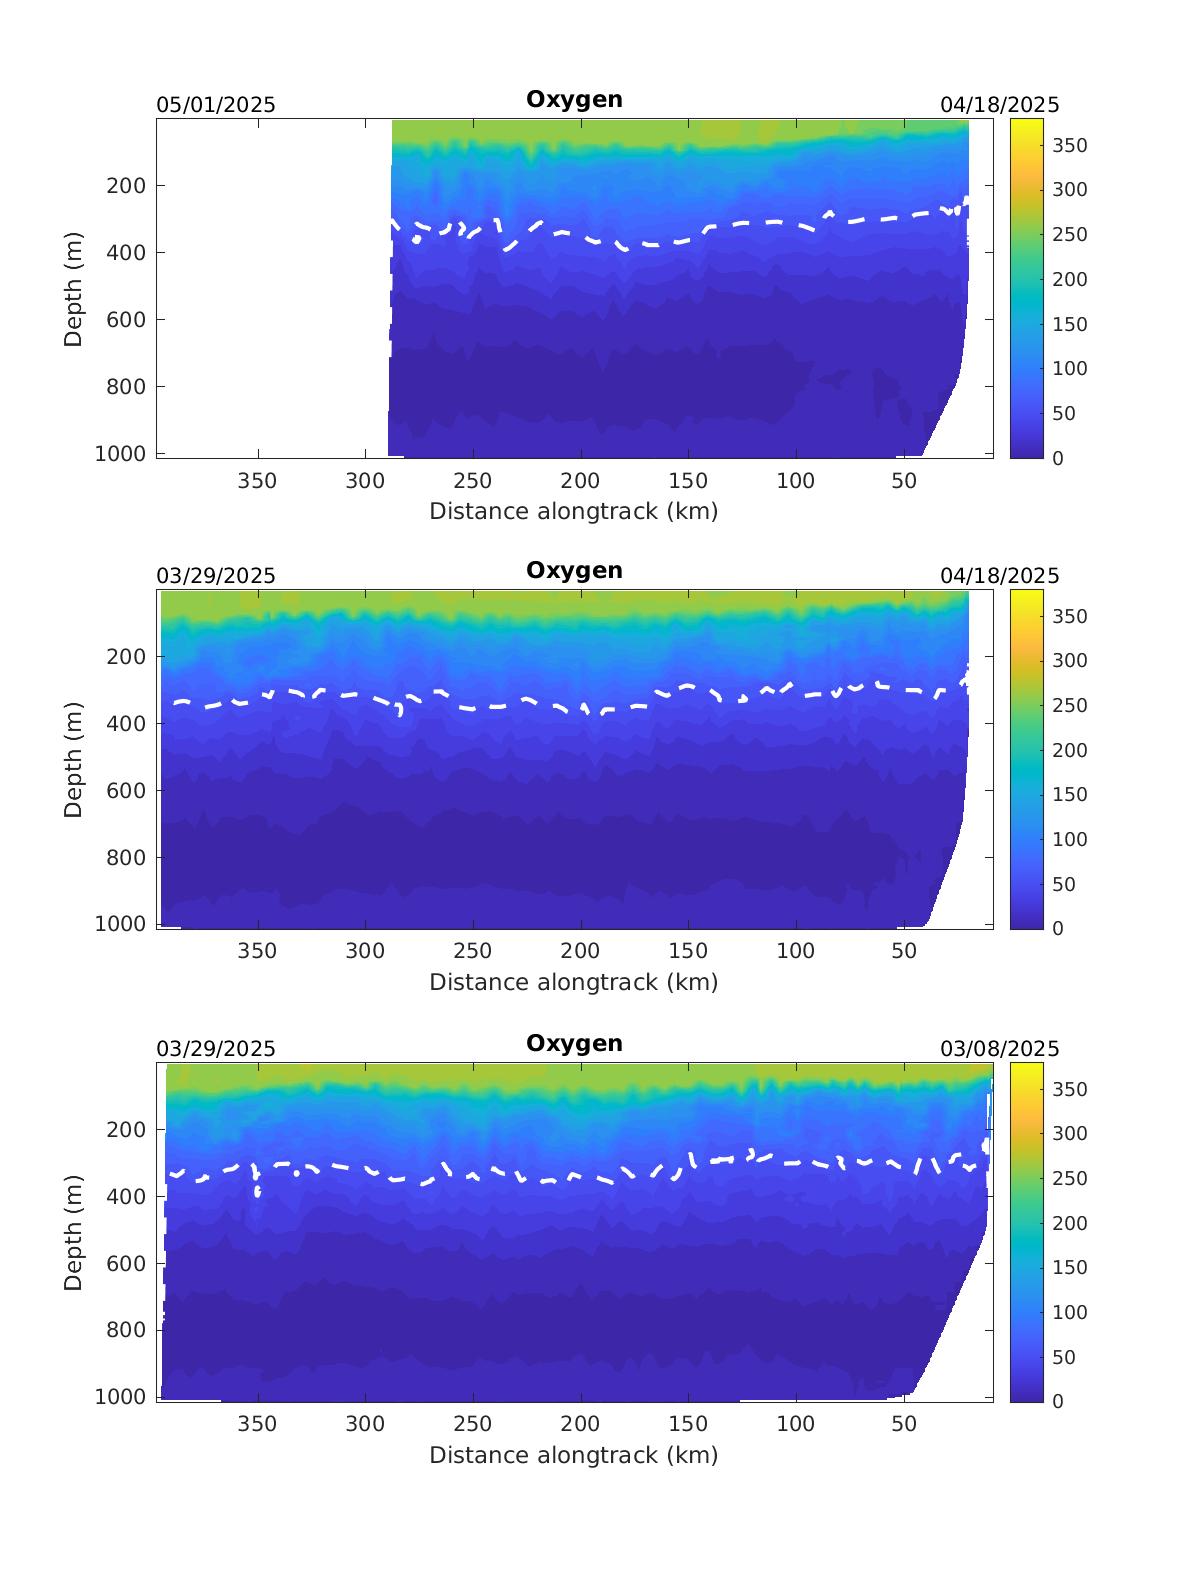
Oxygen(µmol/L)
The white contour is at 62.4 µmol/L. Water below this contour could be considered to be Hypoxic
Fluorescence
Optical Backscatter
Quiver plot – Most Recent Transects
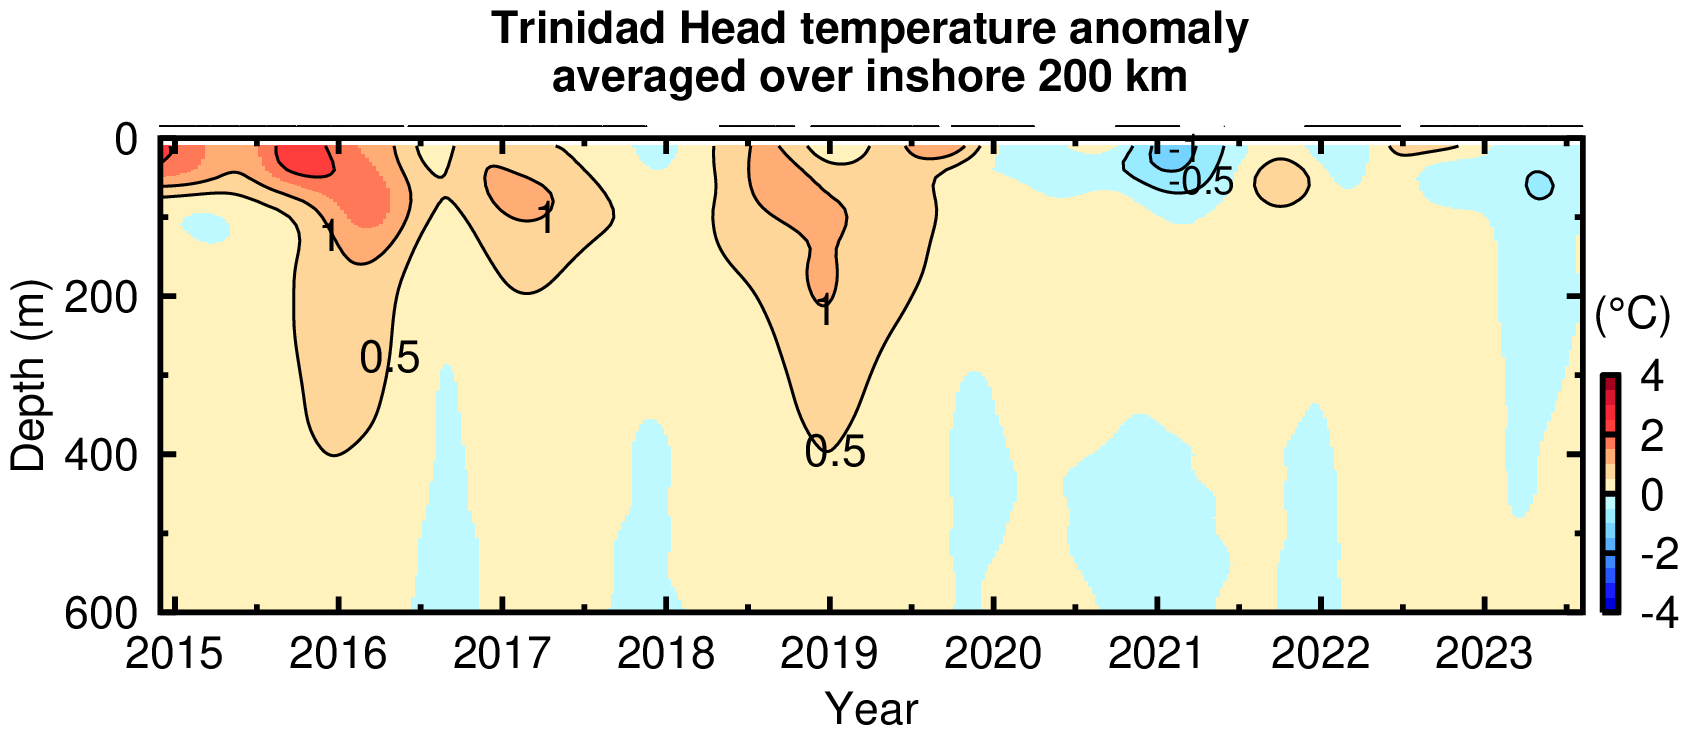
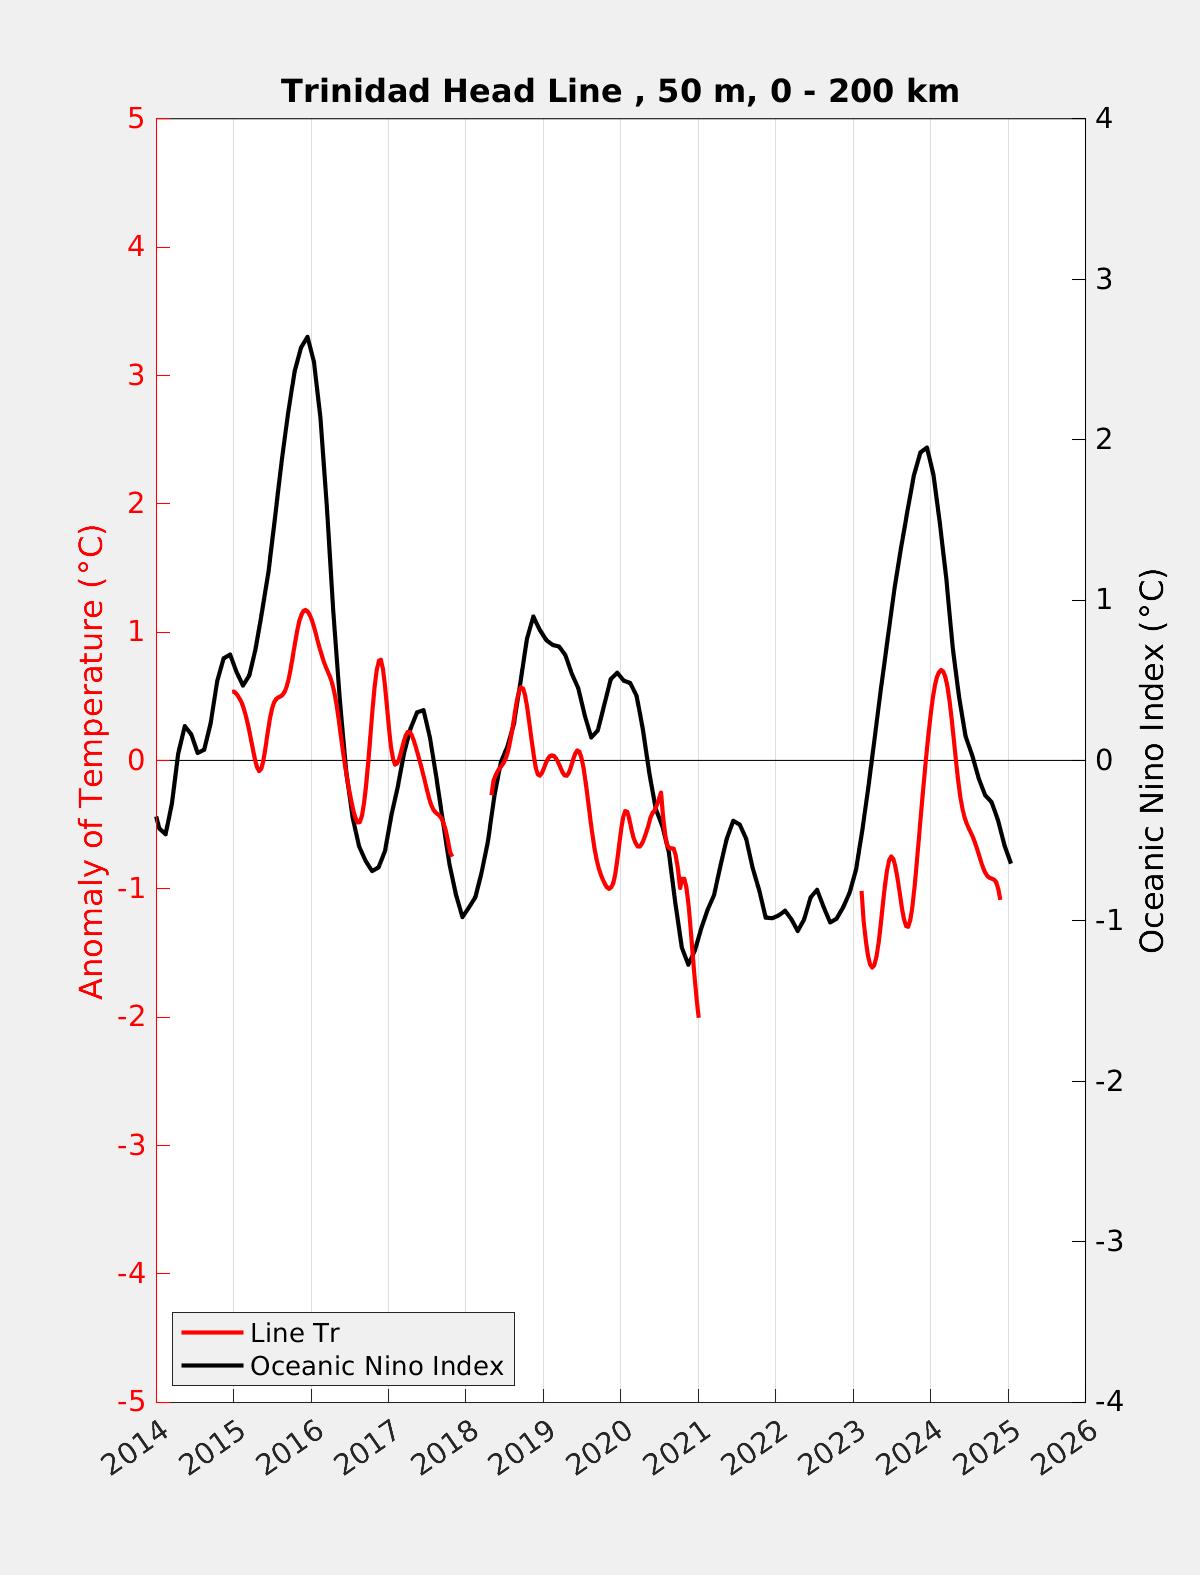
Trinidad Head 50m depth 0-200km average water temperature anomaly based upon Dan Rudnick’s code
Trinidad Head 200 km near-shore temperature anomaly. Courtesy of Dr. Jack Barth