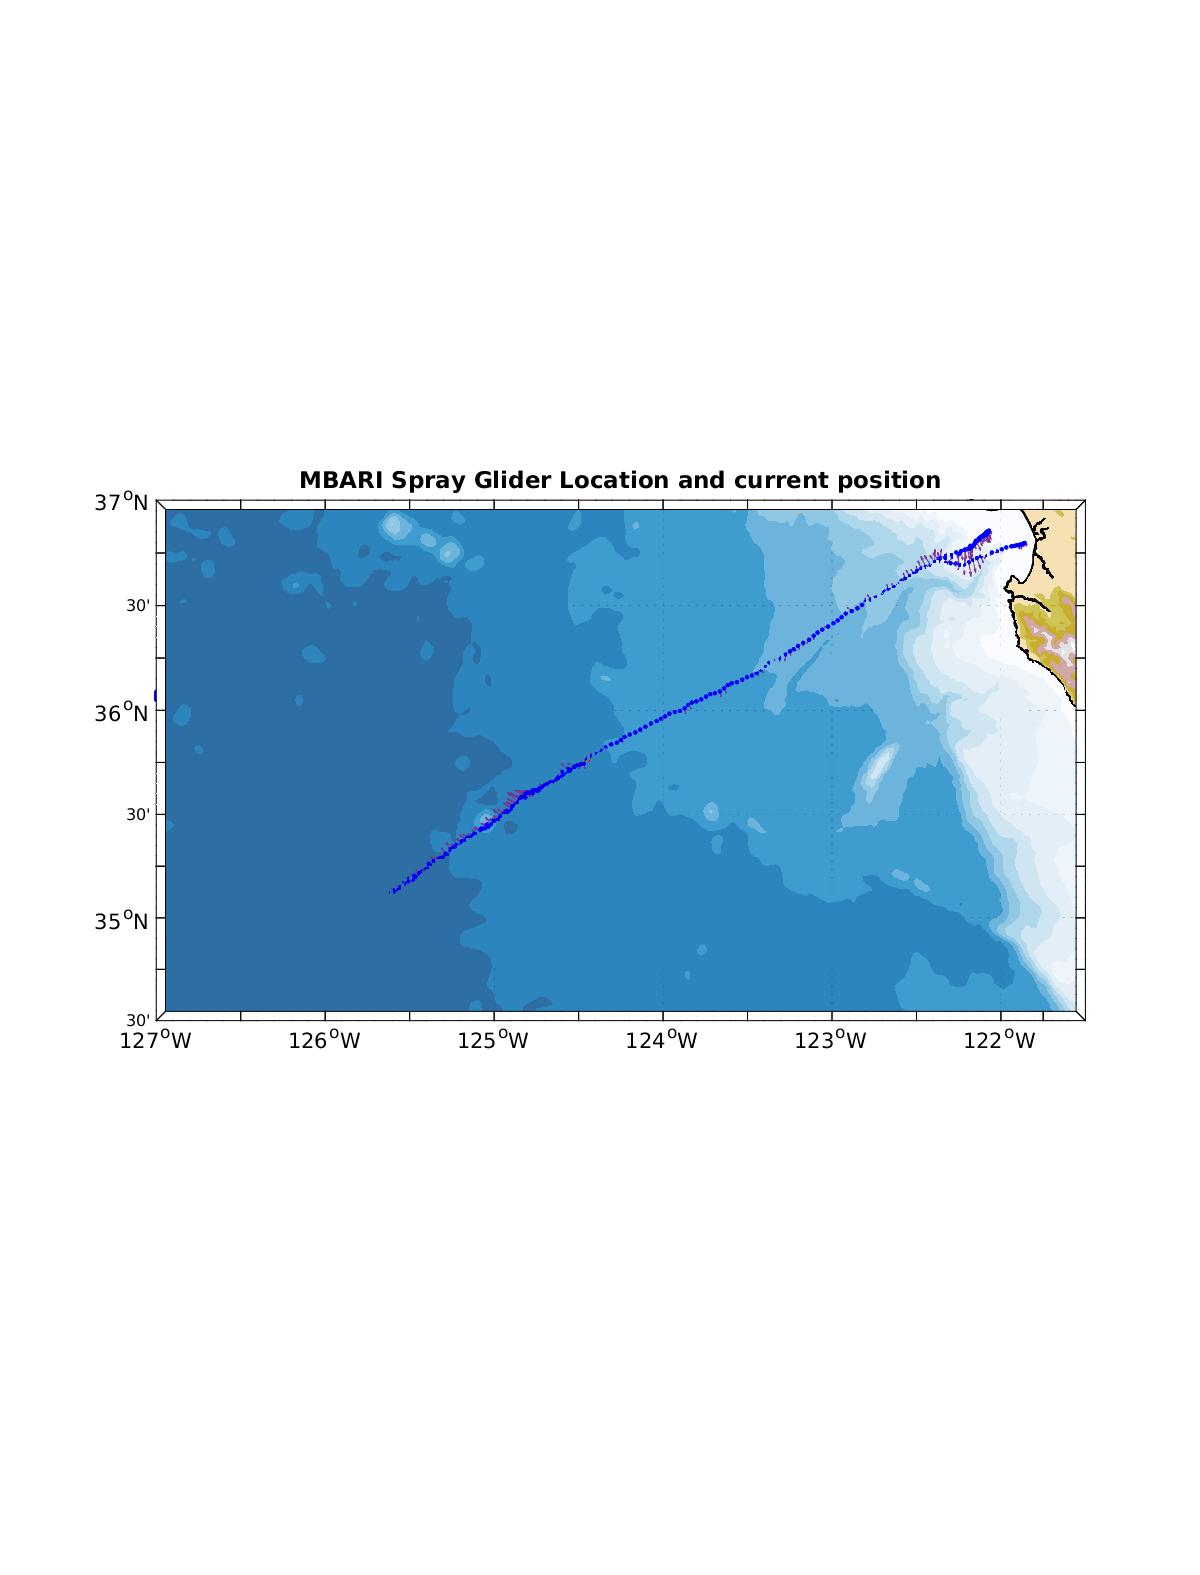
Current Glider Position

Track (blue line) and current location (red dot)
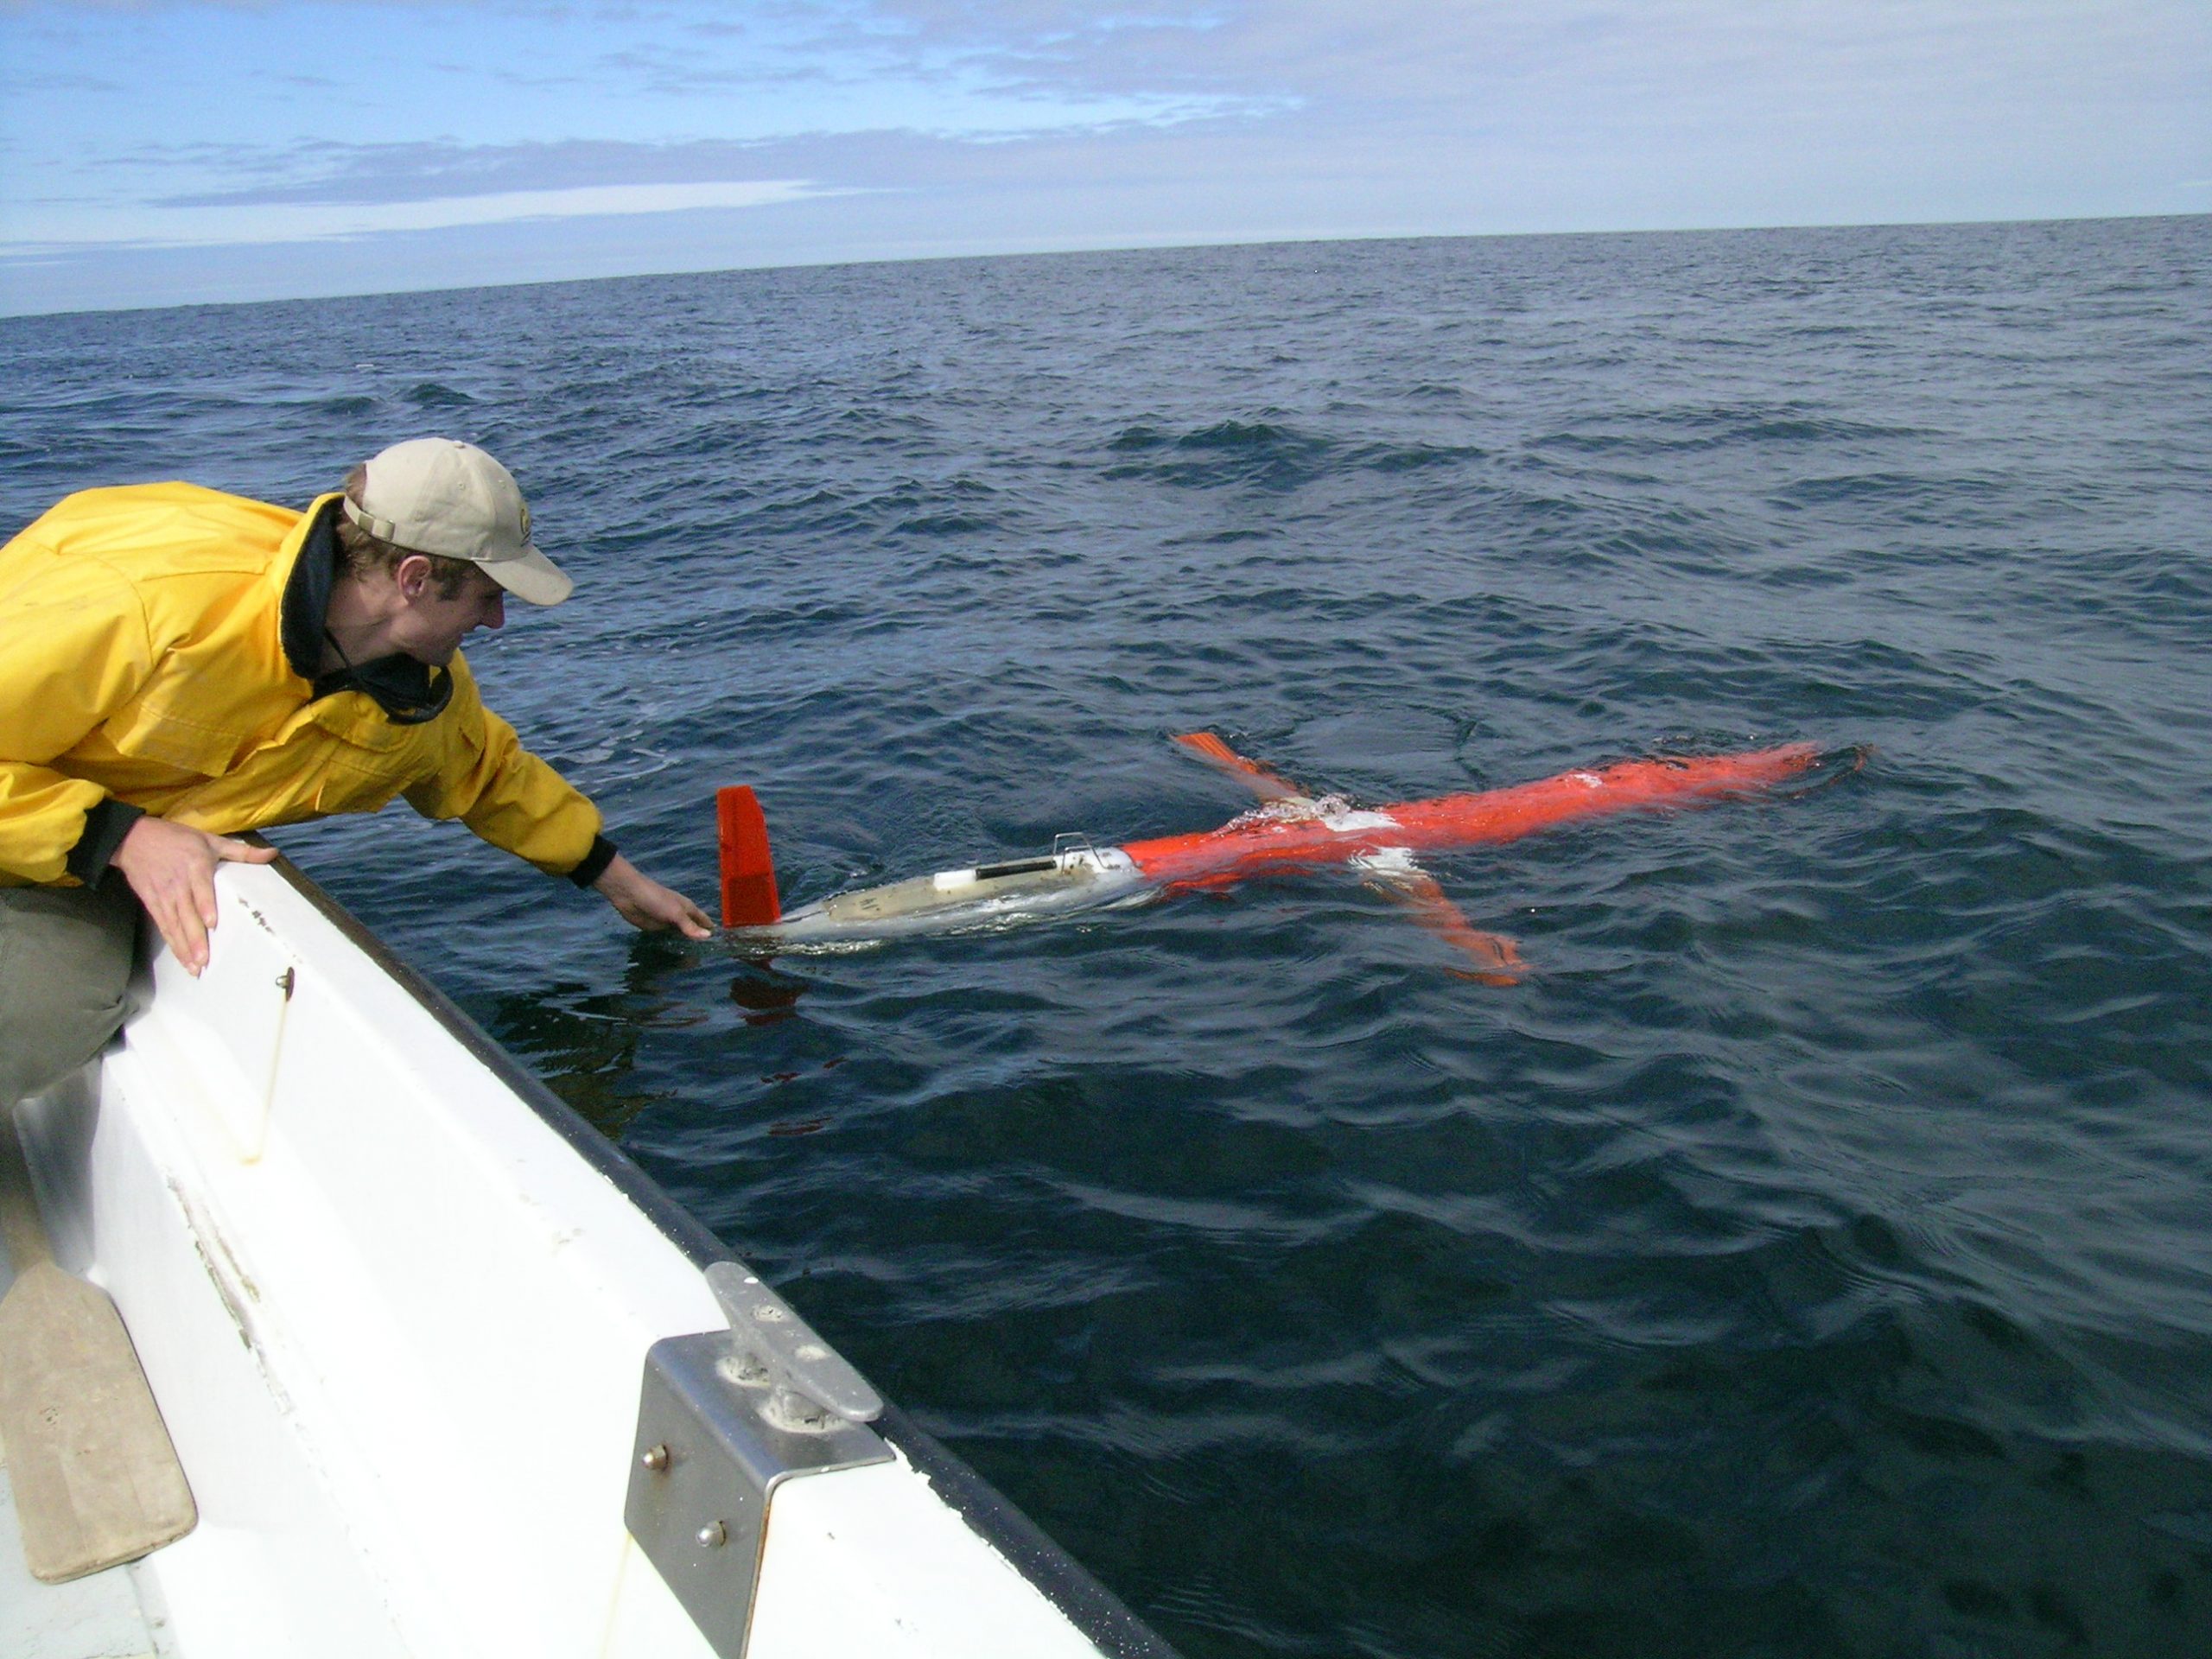
A glider continuously transects CalCOFI Line 66.7 between Monterey Bay and 500 km offshore to the southwest. Gliders have been collecting observations along this track since 2007. The map on the right shows the current location of the active glider.The active mission data is plotted below and data from both the active and completed missions is available for download.
- Download data for all Line 66.7 deployments
- Graphics for deployments from 2007 to 2011
- Seasonal Climatology
Active Mission Plots
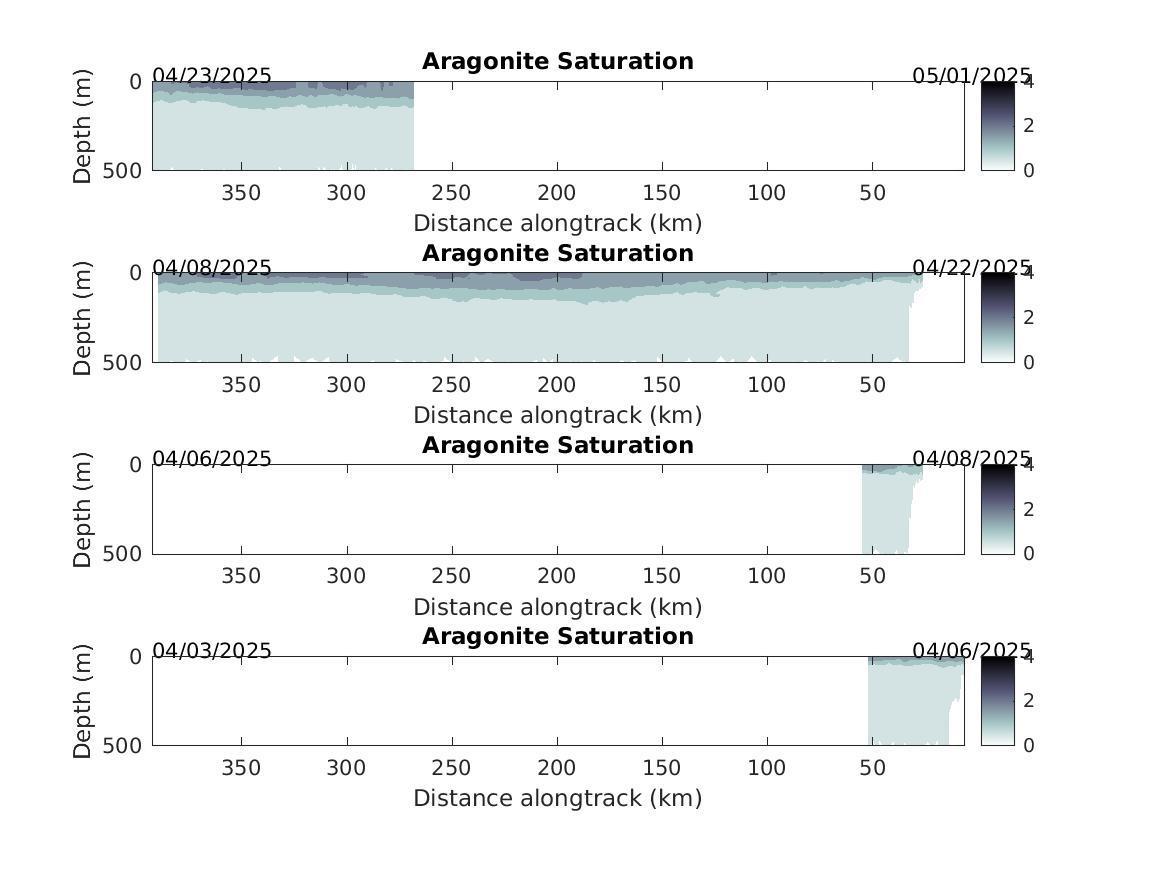
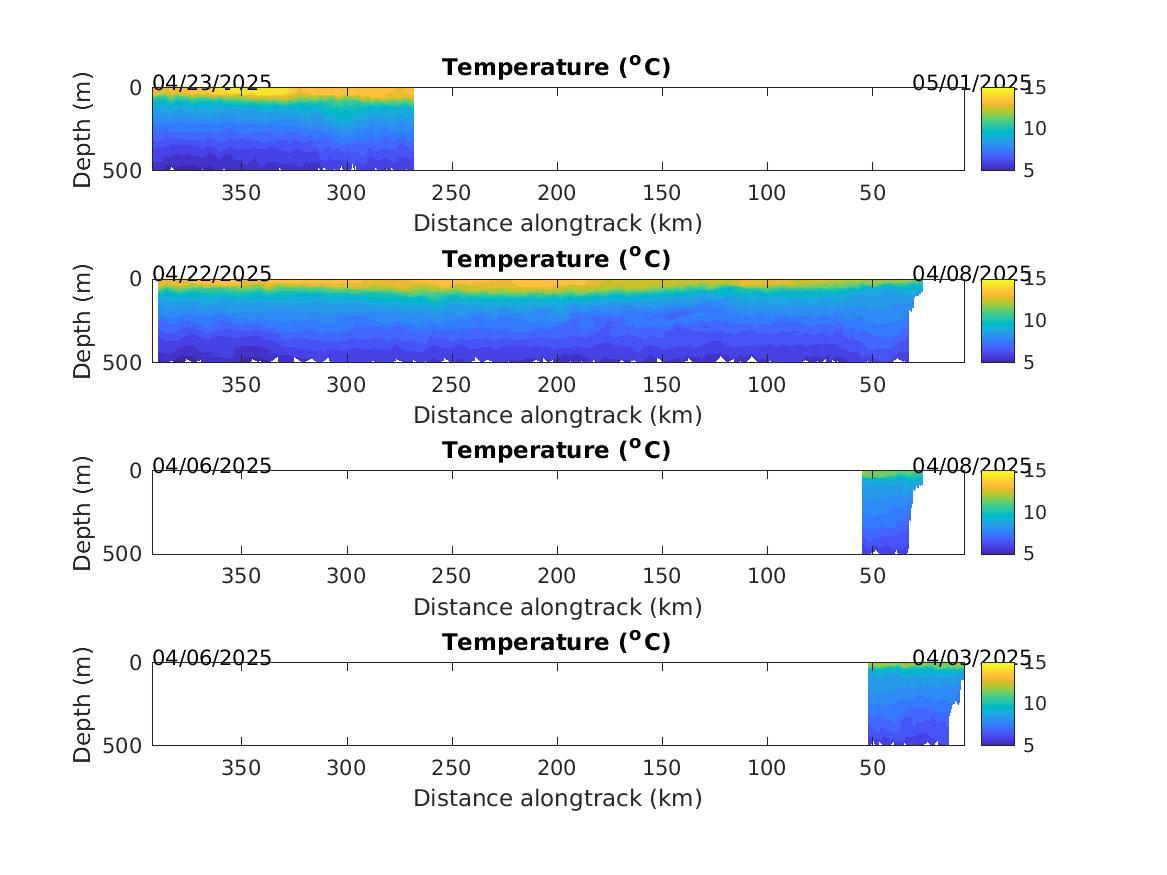
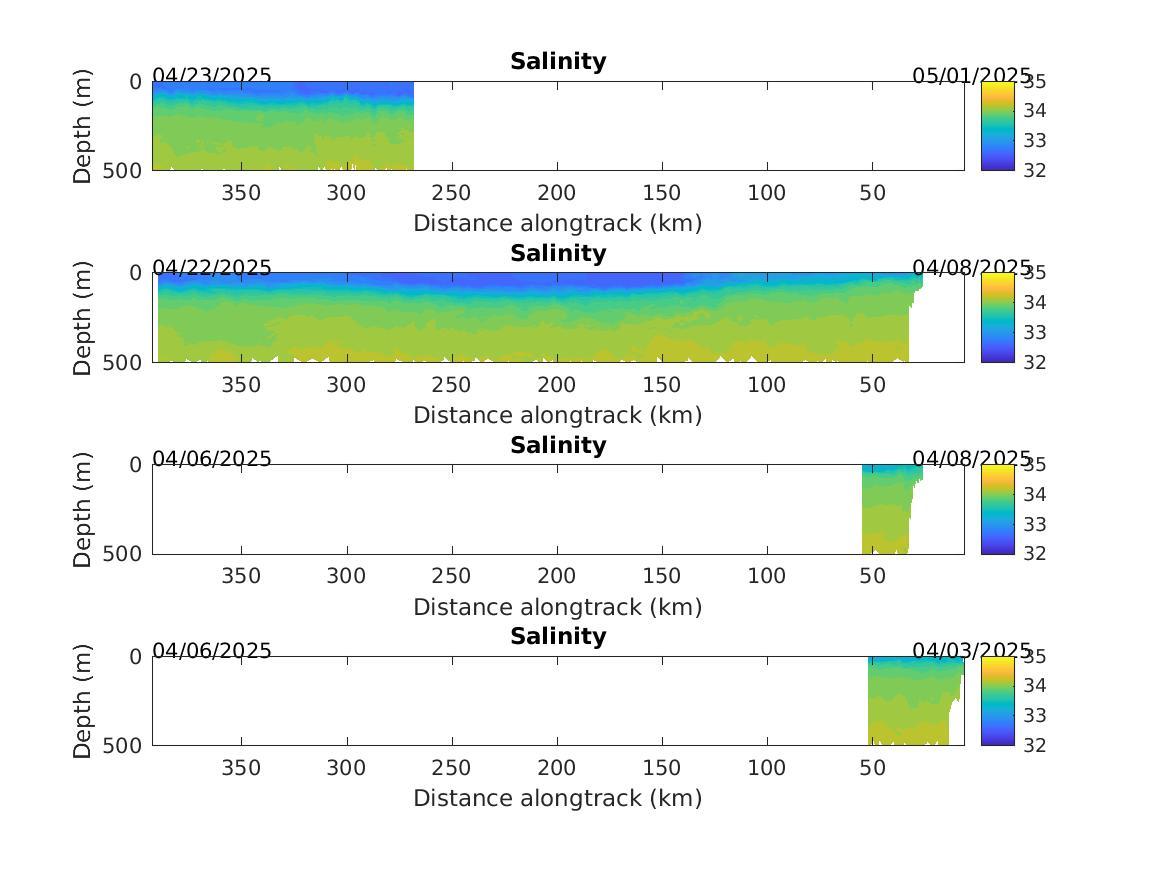
Plot Details: The contour plots below are updated every 4 hours and display water temperature, salinity, chlorophyll flourescence and acoustic backscatter from the surface to 500 meters depth. The top plot for each variable is the most recent glider transect. The dates on the top axis of plot provide a reference to the start and end time of that stretch of data. The x-axis on each plot represents the distance along the track and indicate the glider’s direction (towards or away from shore). Learn more about how to interpret glider contour plots
Temperature – Most Recent Transects
Salinity – Most Recent Transects
Fluorescence – Most Recent Transects

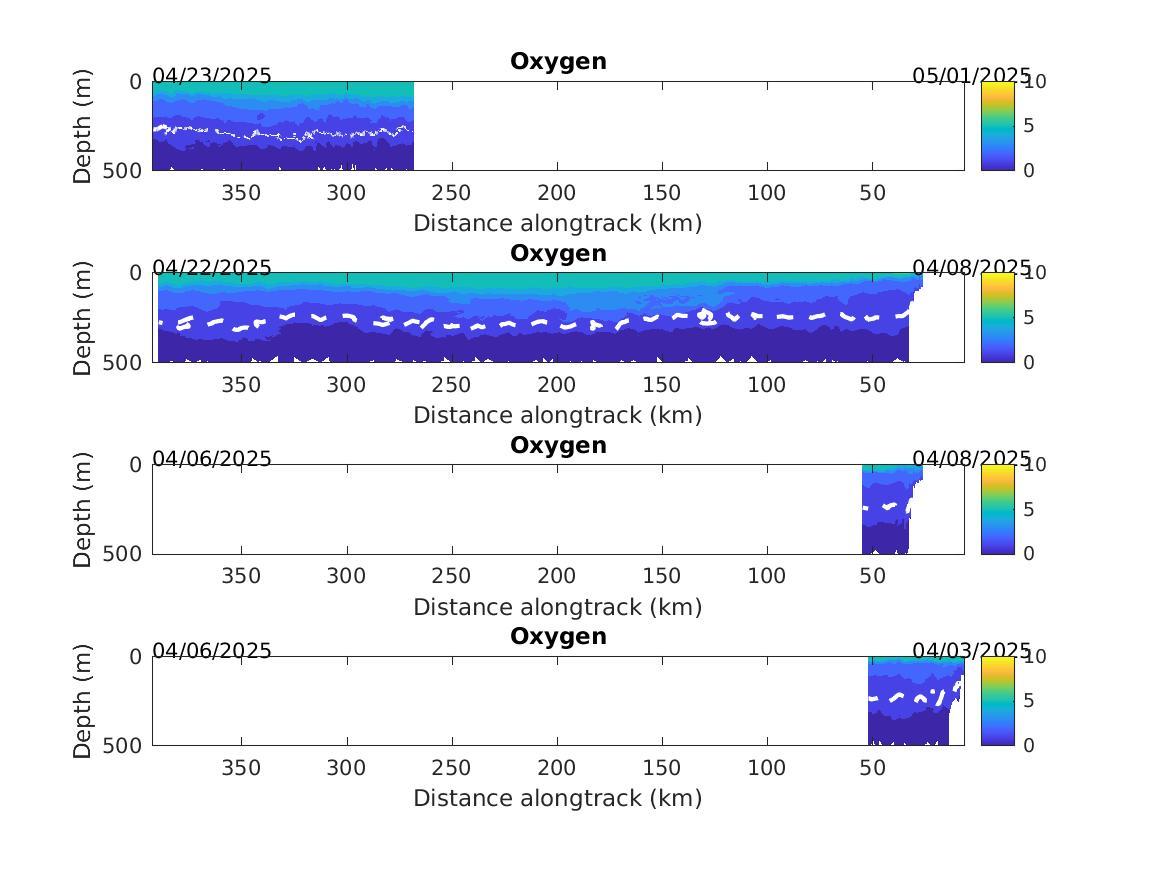
Dissolved Oxygen (ml/L) – Most Recent Transects
The white line on the plots is the 1.4 ml/L contour. Water below this contour could be considered Hypoxic.
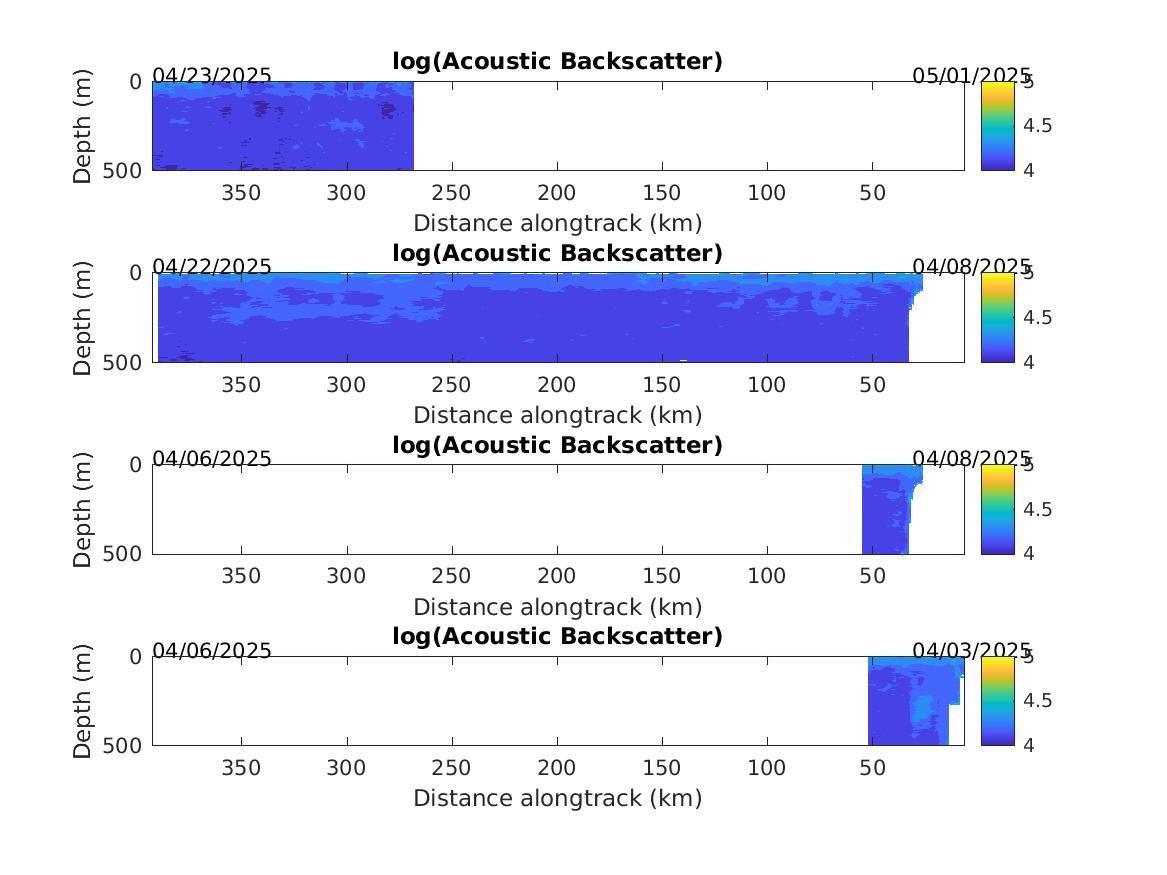
Acoustic Backscatter – Most Recent Transects
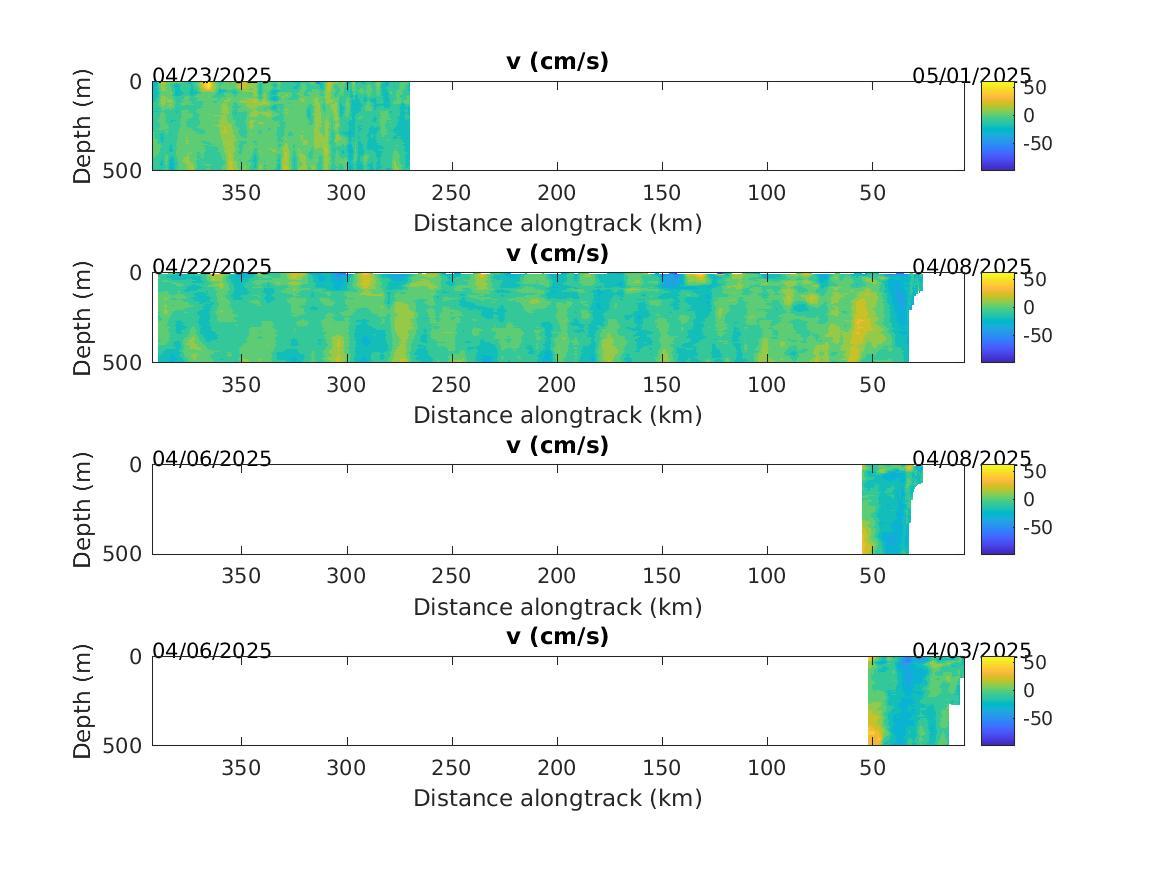
North-South Velocity Component – Most Recent Transects
East-West Velocity Component – Most Recent Transects

Quiver plot – Most Recent Transects
Aragonite Saturation. This is an EXPERIMENTAL product use with CAUTION. Created using Alin et. al. JGR 2012