Glider Track

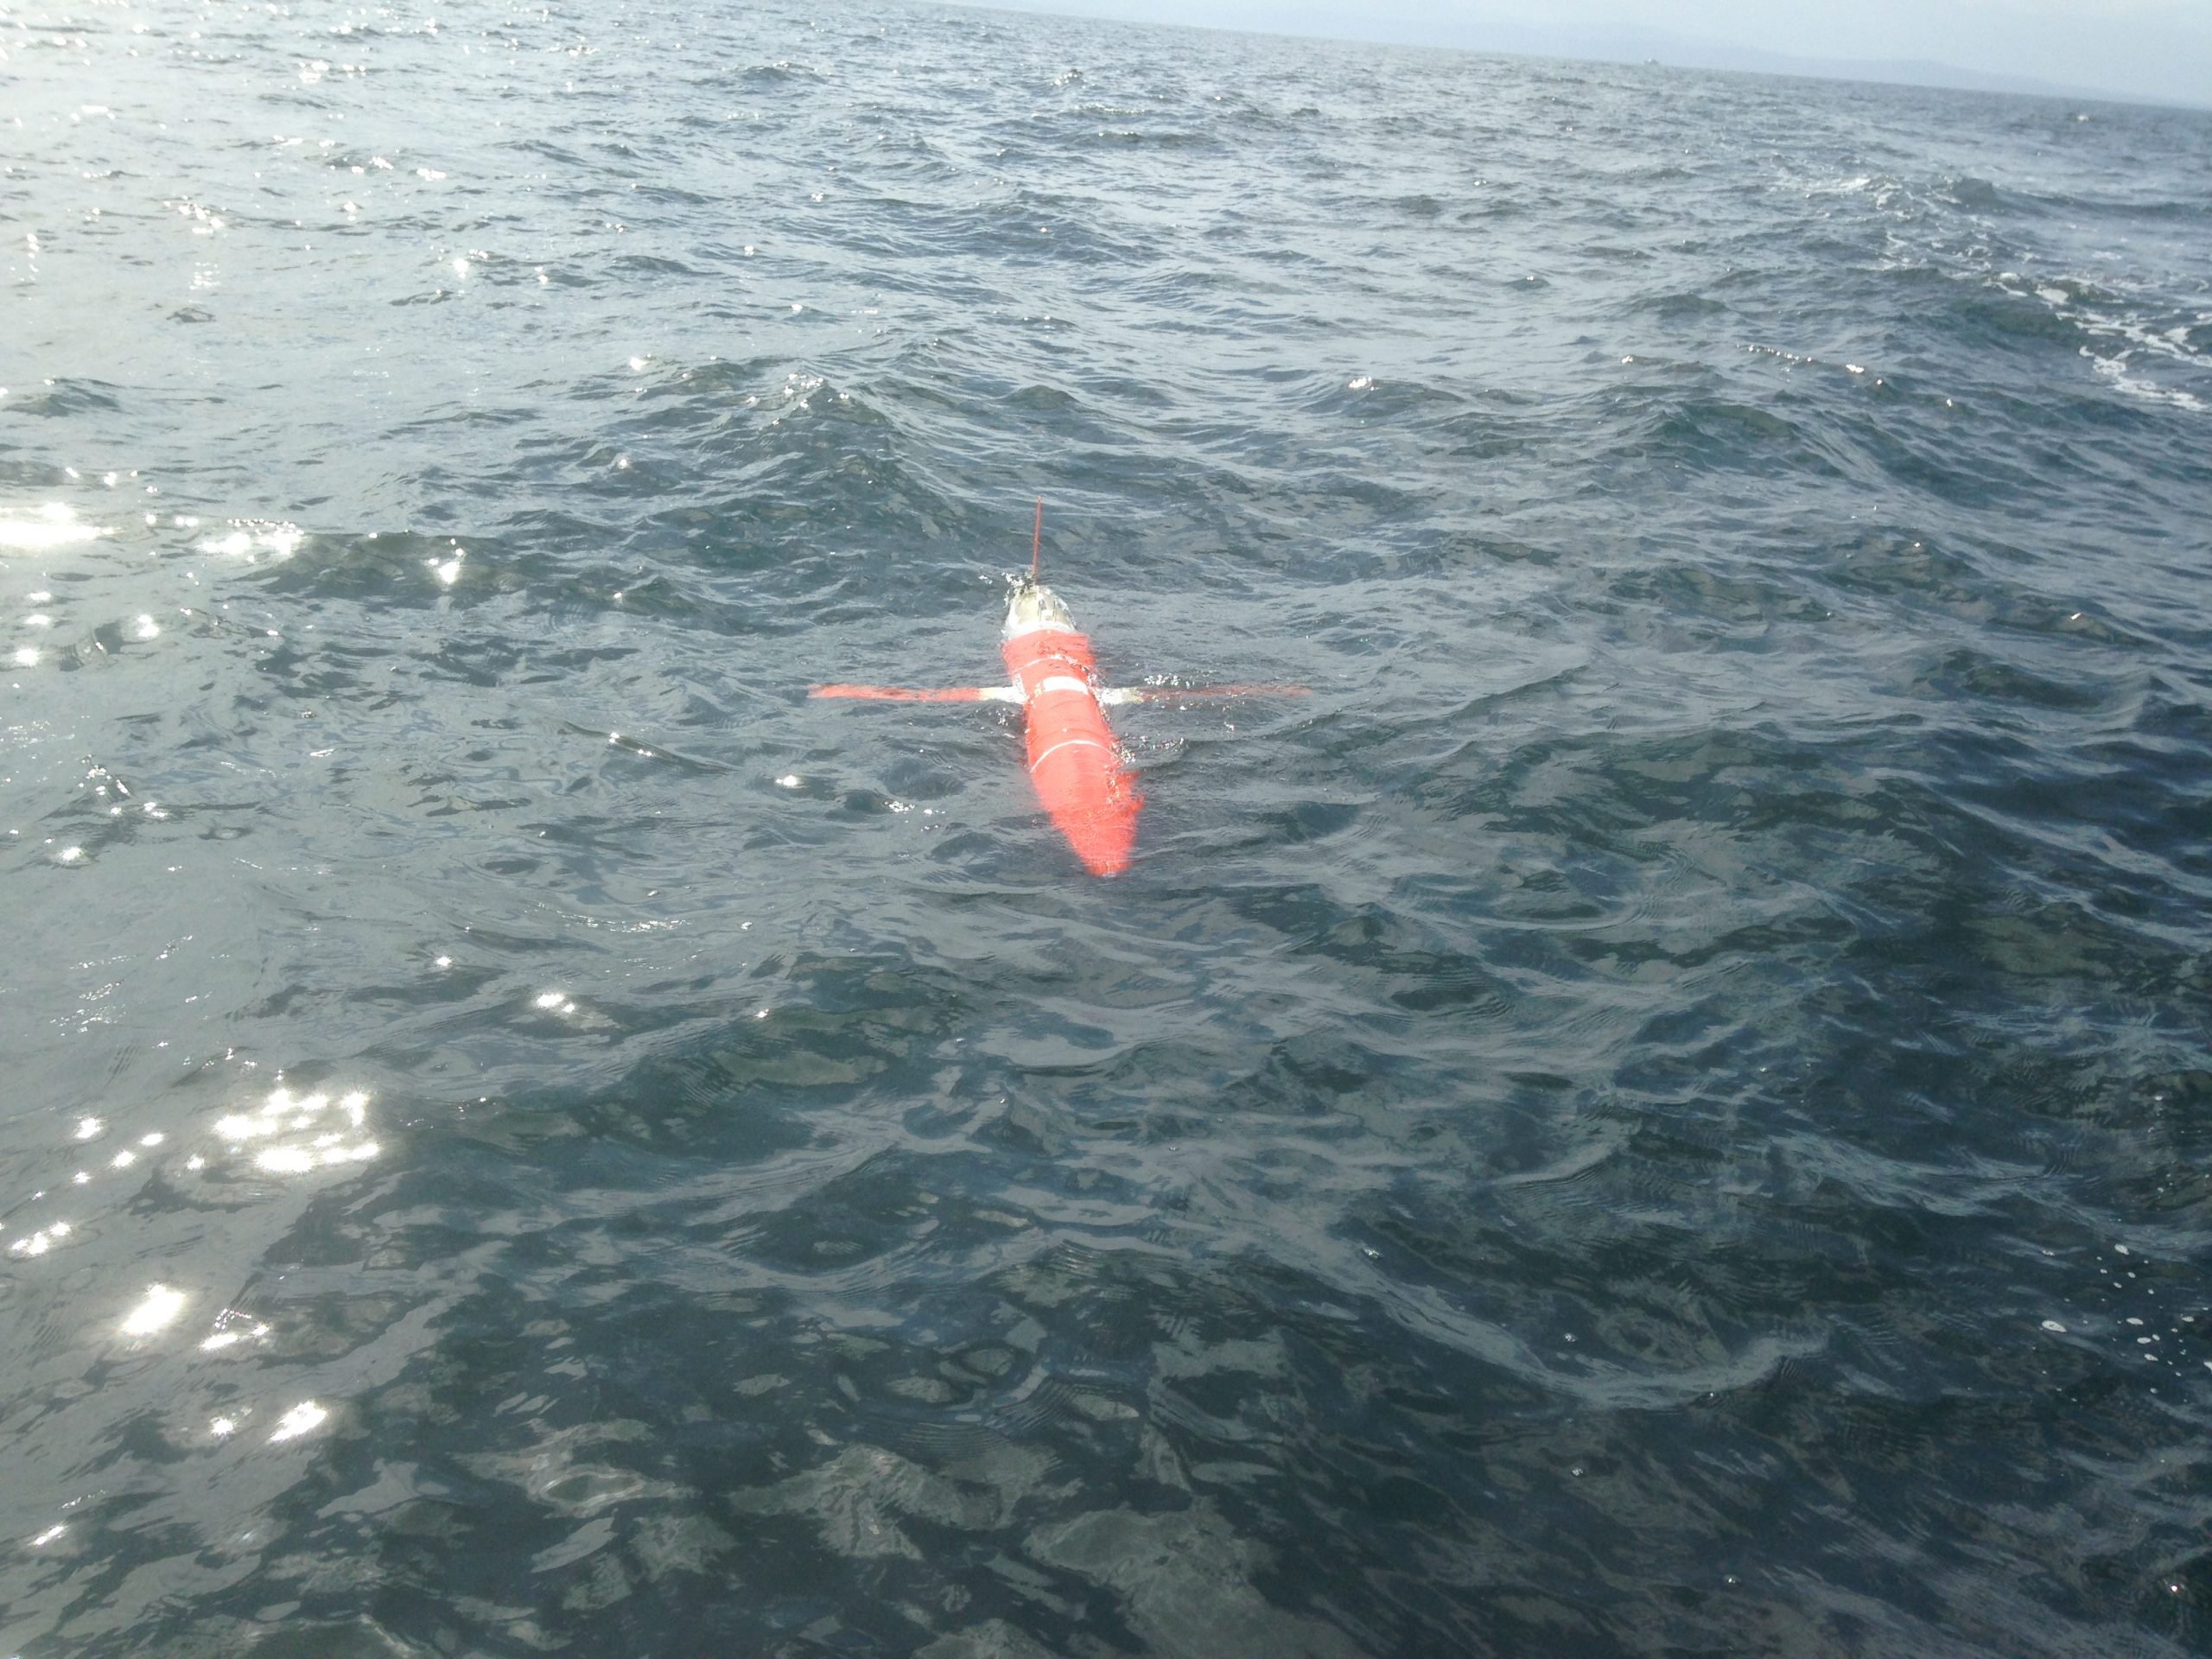
Below are data from the Naval Post Graduate School SPRAY glider 29 deployed in May 6, 2019 in Monterey Bay. The map on the right shows the track of the glider.
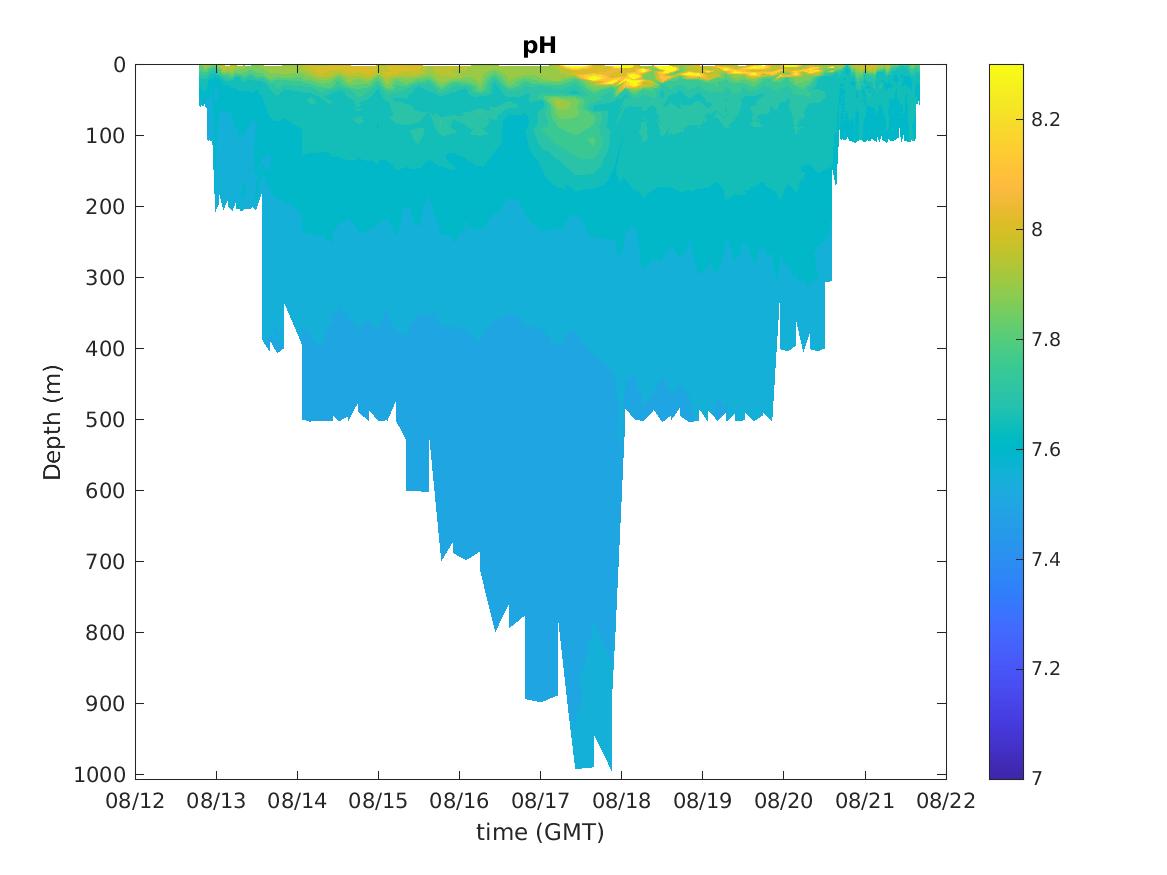
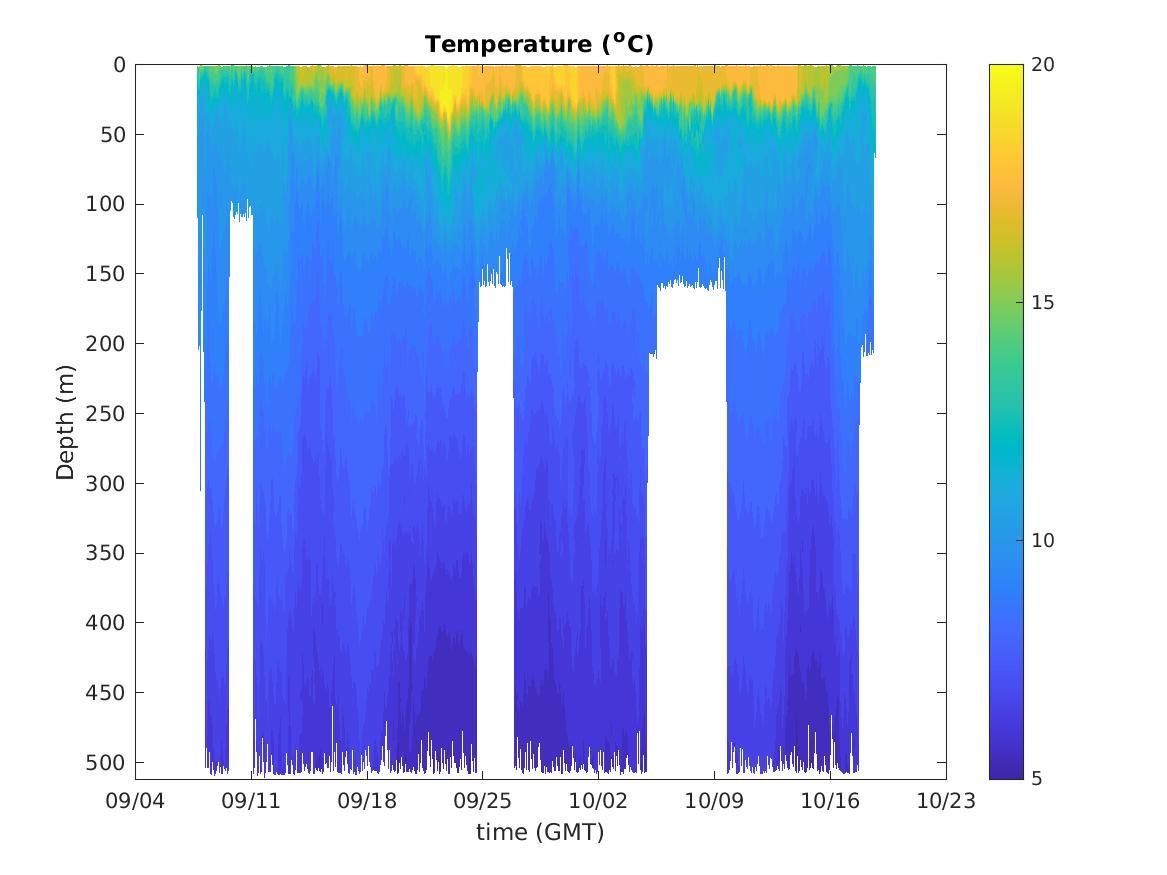
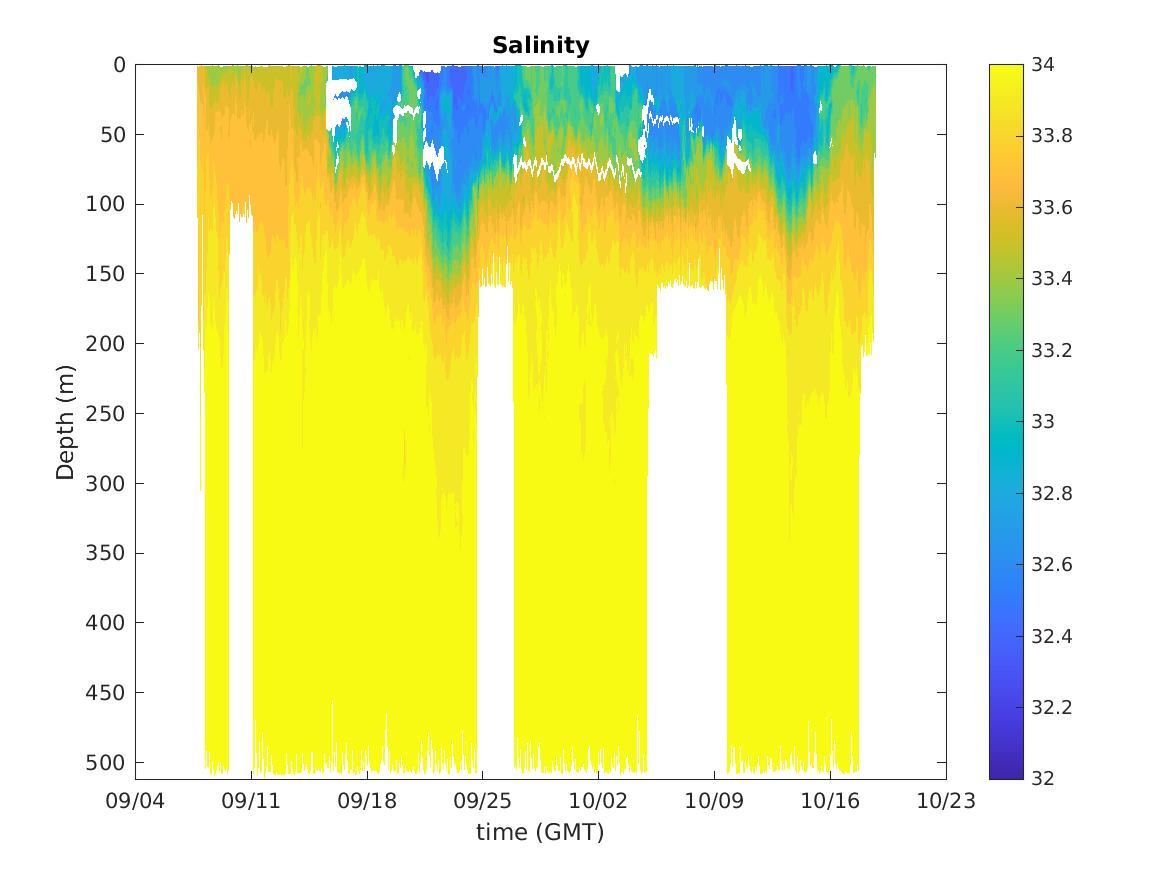
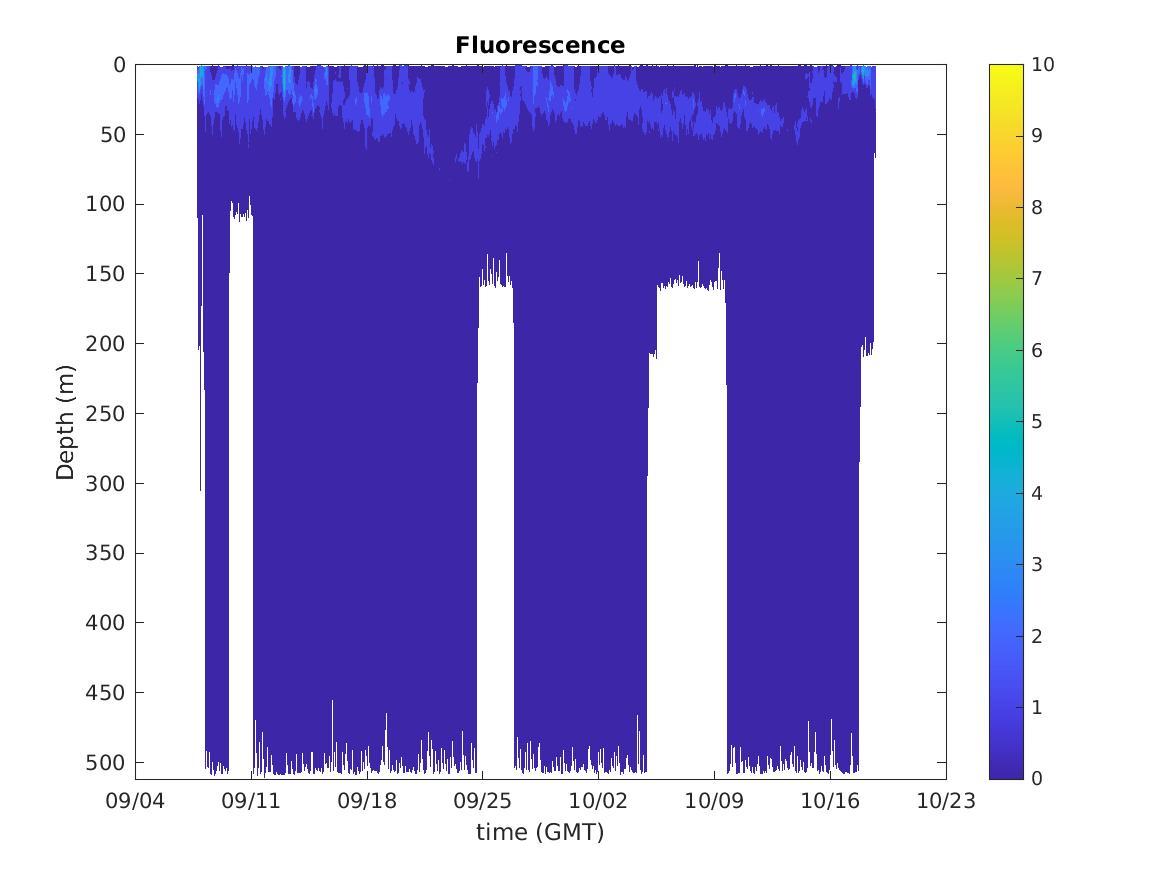
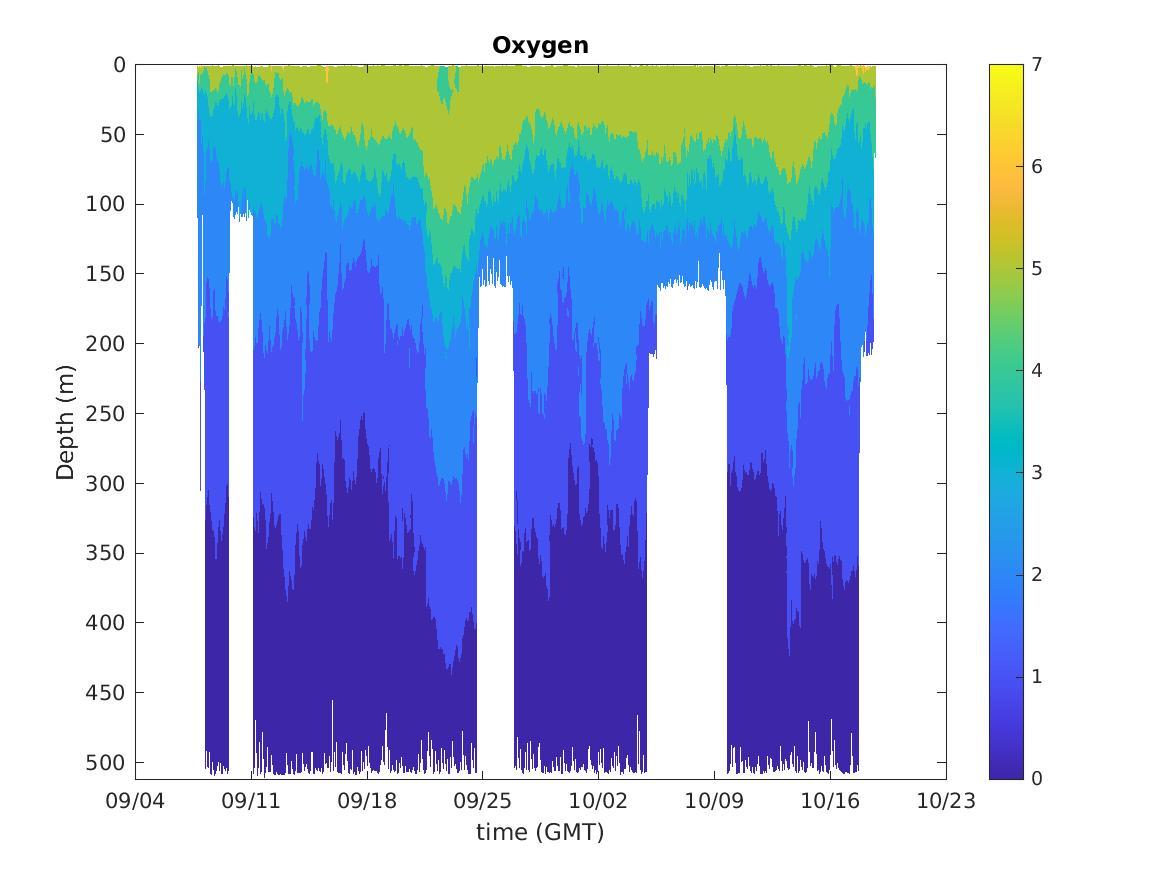
Plot Information: The contour plots below display water temperature, salinity, chlorophyll flourescence and optical backscatter from the surface to 500 meters depth. The x-axis on each plot represents the time since the start of the deployment.
Data for these plots may be obtained from GliderViz
Learn how to interpret glider contour plots
Temperature – Most Recent Transects
Salinity – Most Recent Transects
Fluorescence – Most Recent Transects
Oxygen – Most Recent Transects
pH – Most Recent Transects